This example shows how to create an IoT House Monitoring system that sends humidity, temperature, plant soil moisture, gas, and light sensor data to the cloud on Adafruit IO servers in PictoBloc Python Environment.
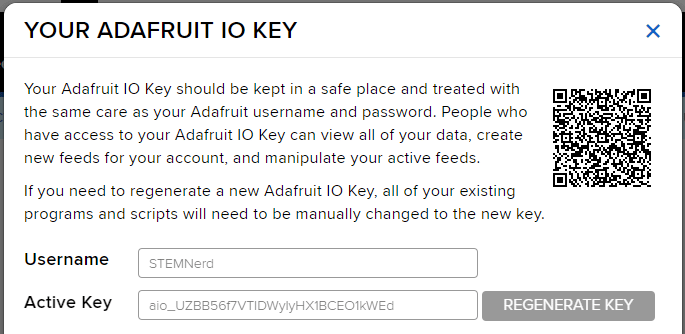
Adafruit IO Key
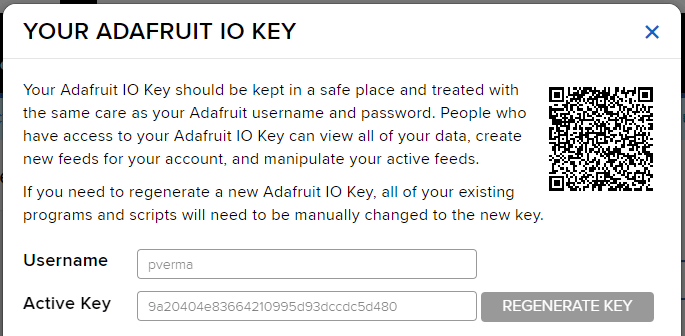
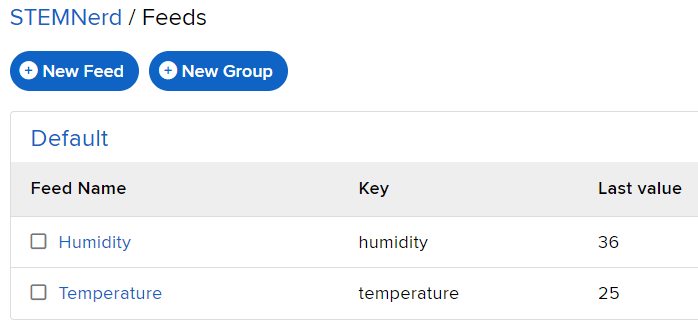
You can find the information about your account once you log in from here:
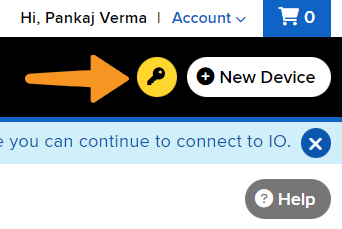
Adafruit IO Key
You can find the information about your account once you log in from here:
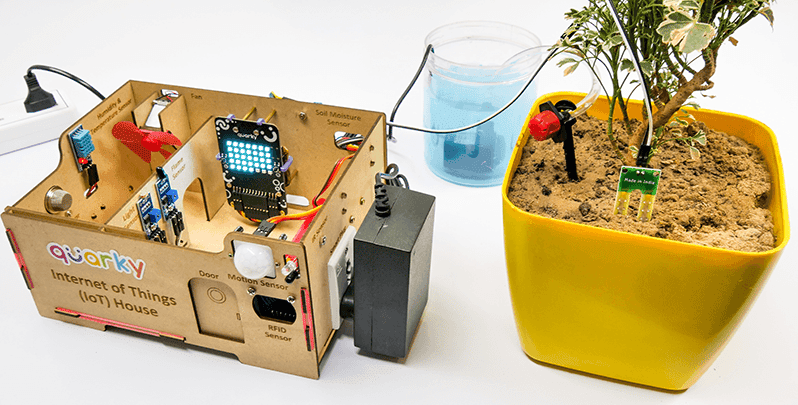
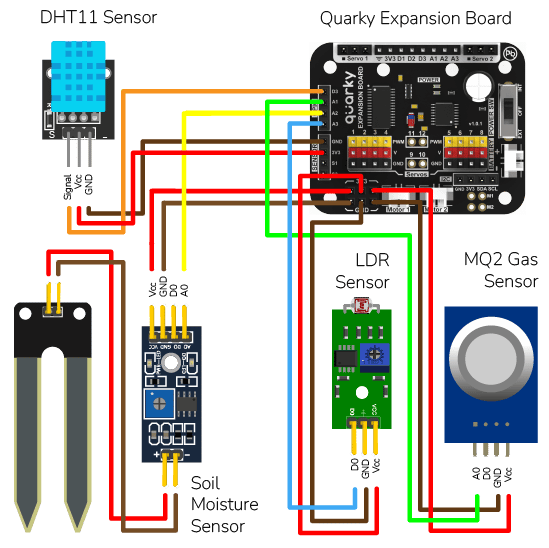
Sensor Connection to Quarky
We are using 4 sensors in this project:
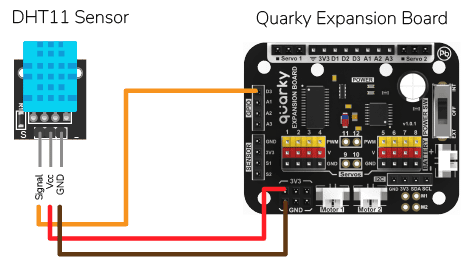
- DHT sensors have 3 pins: GND, VCC, and Signal. You have to connect the following 3 pins to the Quarky Expansion Board:
- GND to Ground Pin of Quarky Expansion Board
- VCC to 3.3V or VCC Pin of Quarky Expansion Board
- Signal to the D3 (Digital Pin) of the Quarky Expansion Board
- LDR sensors have 4 pins: GND, VCC, DO, and AO. You have to connect the following 3 pins to the Quarky Expansion Board:
- GND to Ground Pin of Quarky Expansion Board
- VCC to 3.3V or VCC Pin of Quarky Expansion Board
- AO to the A3 (Analog Pin) of the Quarky Expansion Board
- The gas sensor has the following connections:
- GND Pin connected to GND of the Quarky Expansion Board.
- VCC Pin connected to VCC of the Quarky Expansion Board.
- AO (Signal Pin) connected to Analog Pin A1 of the Quarky Expansion Board
- Moisture Sensor: The moisture sensor provides real-time moisture reading from the soil. The moisture sensor connections are as follows:
- GND Pin connected to GND of the Quarky Expansion Board.
- VCC Pin connected to VCC of the Quarky Expansion Board.
- AO (Signal Pin) connected to Analog Pin A2 of the Quarky Expansion Board
Python Code
# The following code connects to a device, reads sensor values and sends them to a data storage.
# First, the necessary packages are imported.
import time
import math

# Then, three objects are created: one for the IoT house with the sensors and one for the AdaIO and one for Quarky.
house = IoTHouse()
adaio = AdaIO()
quarky = Quarky()

# Variables used by the code are created and initialized.
RS_of_Air = 0
R0 = 0
b = 1.413
m = -0.473

# User Defined Functions

# This function calibrates the gas sensor.
def Get_RO_Calibrated():
  Sensor_Value = 0.1
  # This loop reads the sensor value 20 times.
  for i in range(0, 20):
    Sensor_Value += house.gassensorvalue("A1")
  # This line calculates the average of the 20 readings.
  Sensor_Value = (Sensor_Value / 20)

  # This line calculates the RS_of_Air variable.
  RS_of_Air = ((4095 - Sensor_Value) / Sensor_Value)

  # This line calculates the R0 variable.
  R0 = (RS_of_Air / 9.8)
  time.sleep(1)


# This function reads the gas sensor.
def Get_Gas_Sensor_Reading():
  # This line reads the sensor value.
  Sensor_Value = house.gassensorvalue("A1")
  # This line checks if the sensor value is 0.
  if (Sensor_Value == 0):
    # This line returns 0 if the sensor value is 0.
    return 0
  else:
    # This line calculates the RS_of_Air variable.
    RS_of_Air = ((4095 - Sensor_Value) / Sensor_Value)
    # This line calculates the RS_RO_Ratio variable.
    RS_RO_Ratio = (RS_of_Air / R0)
    # This line calculates the PPM_in_Log variable.
    PPM_in_Log = (((math.log(RS_RO_Ratio)) - b) / m)
    # This line calculates the PPM variable.
    PPM = (pow(10, PPM_in_Log))
    # This line returns the PPM value.
    return PPM

# This line calls the Get_RO_Calibrated() function.
Get_RO_Calibrated()

# This line connects the program to the AdaIO data storage.
adaio.connecttoadafruitio("STEMNerd", "aio_UZBB56f7VTIDWyIyHX1BCEO1kWEd")

# This line sets the pin to read the moisture sensor.
house.setmoisturepin("A3")

# This loop reads the sensors, prints their values and sends them to the data storage.
while True:
  # This line reads the temperature from the DHT sensor on pin D3 and sends it to the data storage.
  Temperature = house.dhtmeasure(1, "D3")
  adaio.createdata("Temperature", Temperature)
  time.sleep(4)

  # This line reads the humidity from the DHT sensor on pin D3 and sends it to the data storage.
  Humidity = house.dhtmeasure(2, "D3")
  adaio.createdata("Humidity", Humidity)
  time.sleep(4)

  # This line reads the light from the light sensor on pin A2 and sends it to the data storage.
  Light = house.ldrvalue("A2")
  adaio.createdata("Light", Light)
  time.sleep(4)

  # This line reads the moisture from the moisture sensor and sends it to the data storage.
  Moisture = house.readmoisture()
  adaio.createdata("Moisture", Moisture)
  time.sleep(4)

  # This line calls the Get_Gas_Sensor_Reading() function to read the gas sensor and sends the value to the data storage.
  PPM = Get_Gas_Sensor_Reading()
  adaio.createdata("Gas Sensor", PPM)
  time.sleep(4)
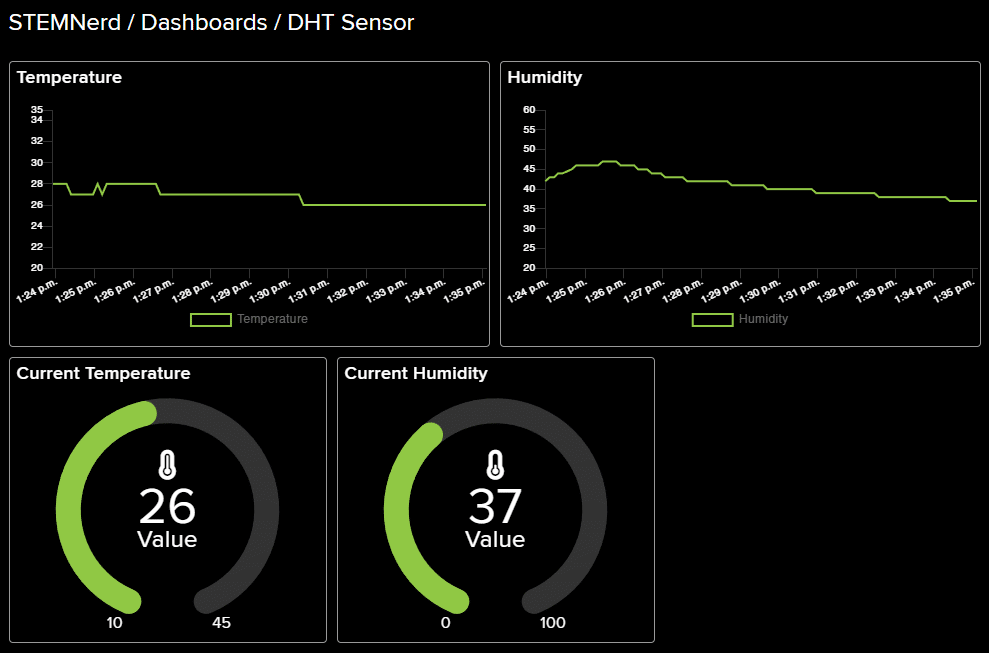
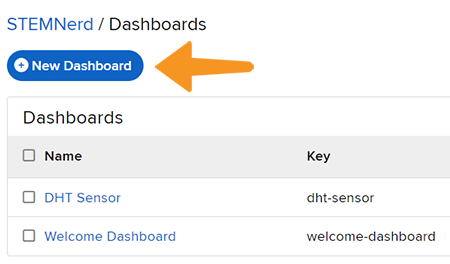
Creating Dashboard
Follow the steps:
- Go to the dashboard and click on New Dashboard.
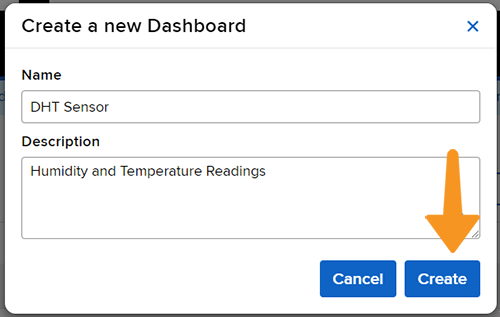
- Add the Dashboard Name and Description and click on Create.
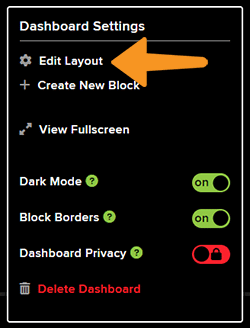
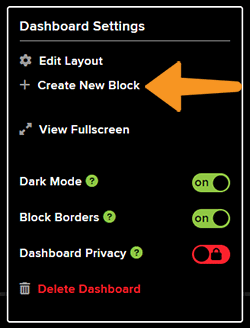
- Open the New Dashboard. Click on the Setting icon in the top right corner and then click on Create New Block.
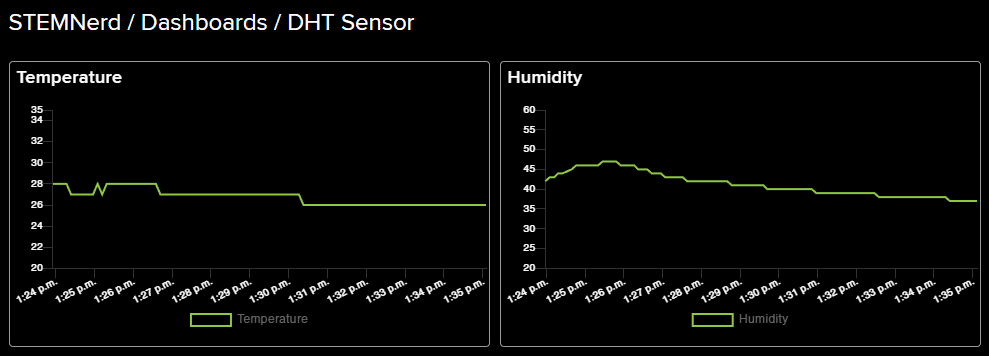
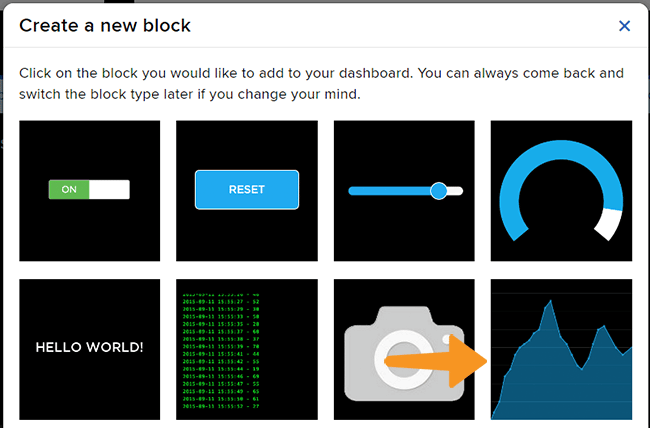
- From the options, click on the line chart.
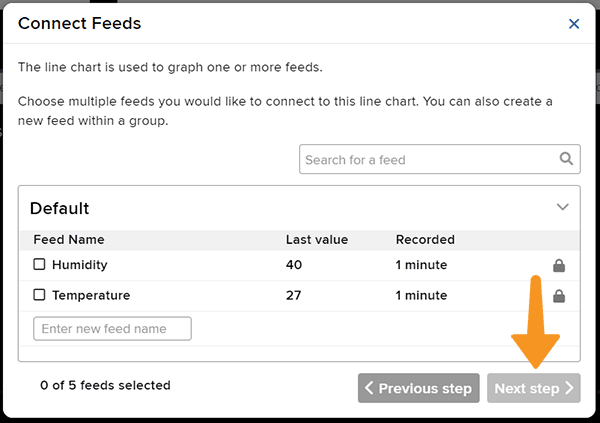
- Select the Temperature Feed and click on Next Step.
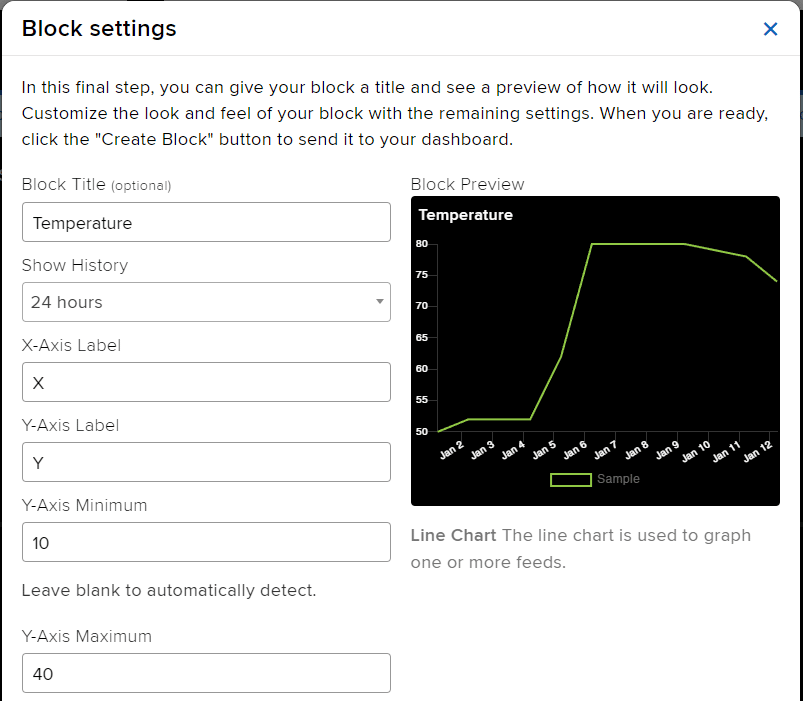
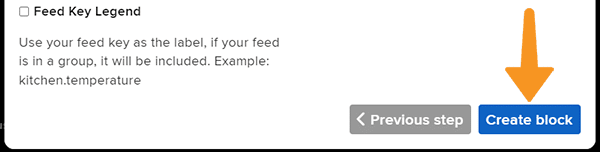
- Add the Block Title and the Y-Axis Minimum – Maximum value. Click on Create Block.
- You will find the block added on the dashboard.
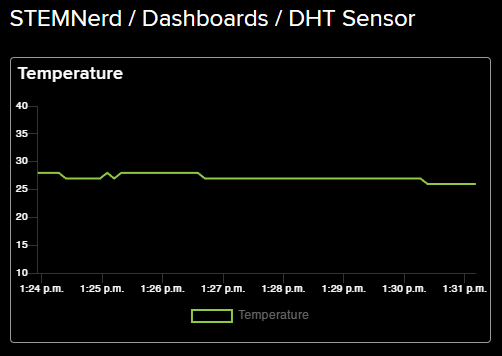
- Add other blocks for the Humidity, Light, Gas, and Moisture as well.
- Click on the Setting button and Edit Layout to align all the buttons.