


We will use the Adafruit IO cloud service to send data from a humidity and temperature sensor to the cloud in the Python Coding Environment of PictoBlox. Adafruit IO is a cloud service that allows you to send data from sensors and other devices to the cloud, where it can be stored and analyzed.
Adafruit IO Key
You can find the information about your account once you log in from here:
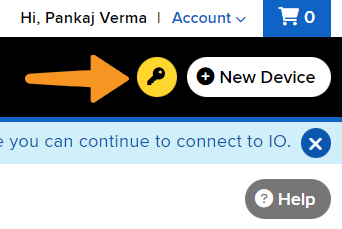
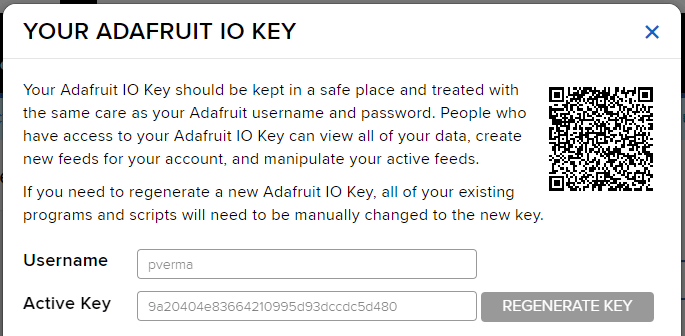

Note: Make sure you are login on Adafruit IO: https://io.adafruit.com/
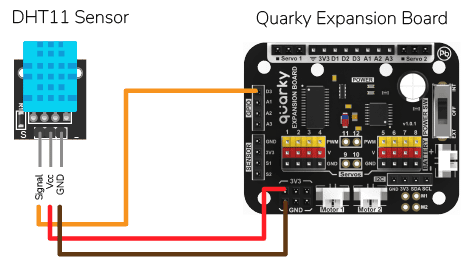
DHT Sensor Connection to Quarky
DHT sensors have 3 pins: GND, VCC, and Signal. You have to connect the following 3 pins to the Quarky Expansion Board:
- GND to Ground Pin of Quarky Expansion Board
- VCC to 3.3V or VCC Pin of Quarky Expansion Board
- Signal to the D3 (Digital Pin) of the Quarky Expansion Board
Code for Stage Mode
# This code is used to connect to the internet and measure the temperature and humidity of the house.
# First, the Quarky object  are created.
quarky = Quarky()

# Time module is imported.
import time

# AdaIO object is created.
adaio = AdaIO()

# IoTHouse object is created.
house = IoTHouse()

# Then, the connection to Adafruit IO is made.
adaio.connecttoadafruitio("STEMNerd", "aio_UZBB56f7VTIDWyIyHX1BCEO1kWEd")

# The feeds for temperature and humidity are created.
adaio.createfeed("Temperature")
adaio.createfeed("Humidity")

# A while loop is used to measure the temperature and humidity continously.
while True:
  # Temperature is measured using the dhtmeasure function.
  adaio.createdata("Temperature", house.dhtmeasure(1, "D3"))
  # The loop pauses for 1 second.
  time.sleep(1)

  # Humidity is measured using the dhtmeasure function.
  adaio.createdata("Humidity", house.dhtmeasure(2, "D3"))
  # The loop pauses for 5 seconds.
  time.sleep(5)
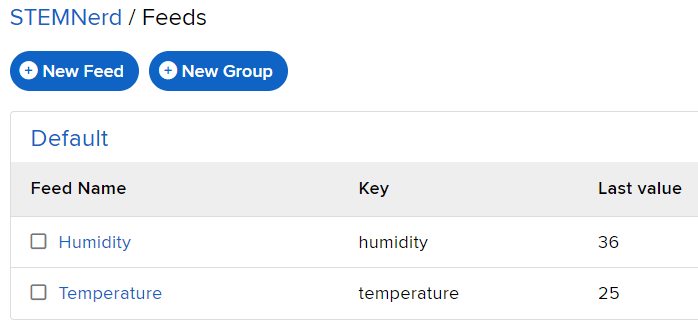
The following feeds are created:
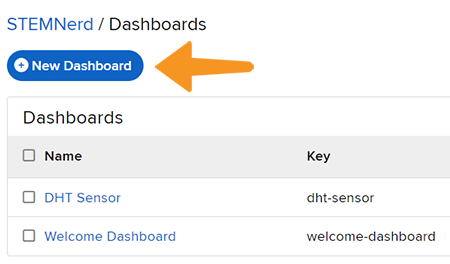
Creating Dashboard
Follow the steps:
- Go to the dashboard and click on New Dashboard.
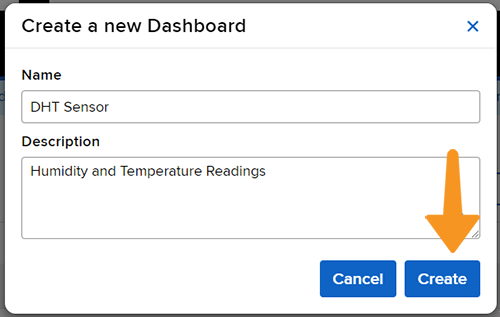
- Add the Dashboard Name and Description and click on Create.
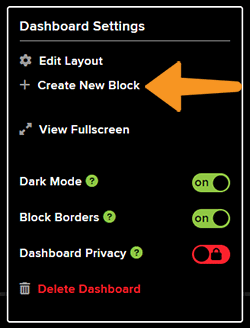
- Open the New Dashboard. Click on the Setting icon in the top right corner and then click on Create New Block.
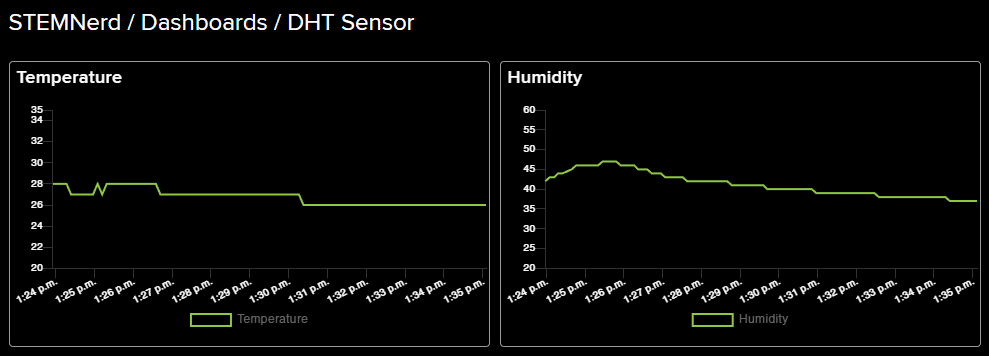
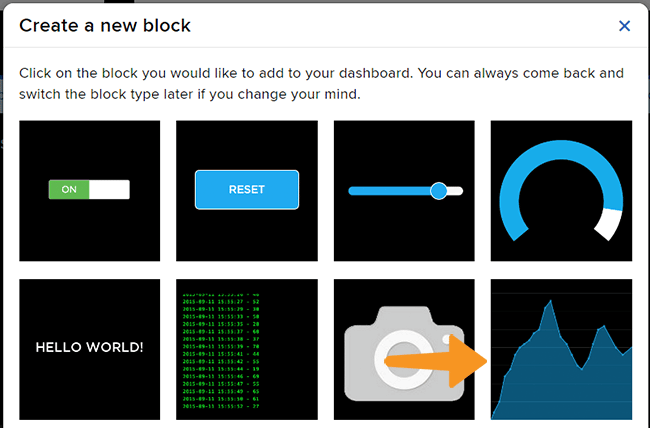
- From the options, click on the line chart.
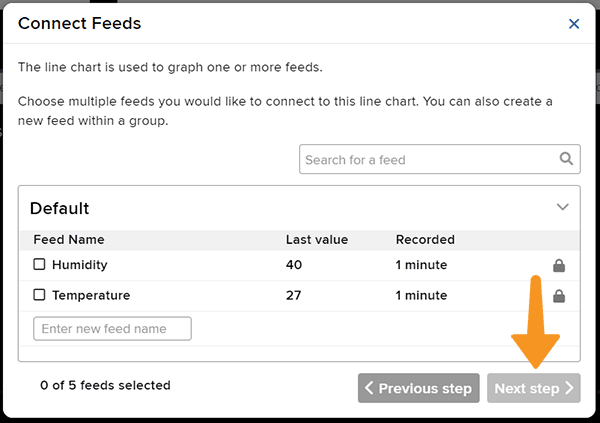
- Select the Temperature Feed and click on Next Step.
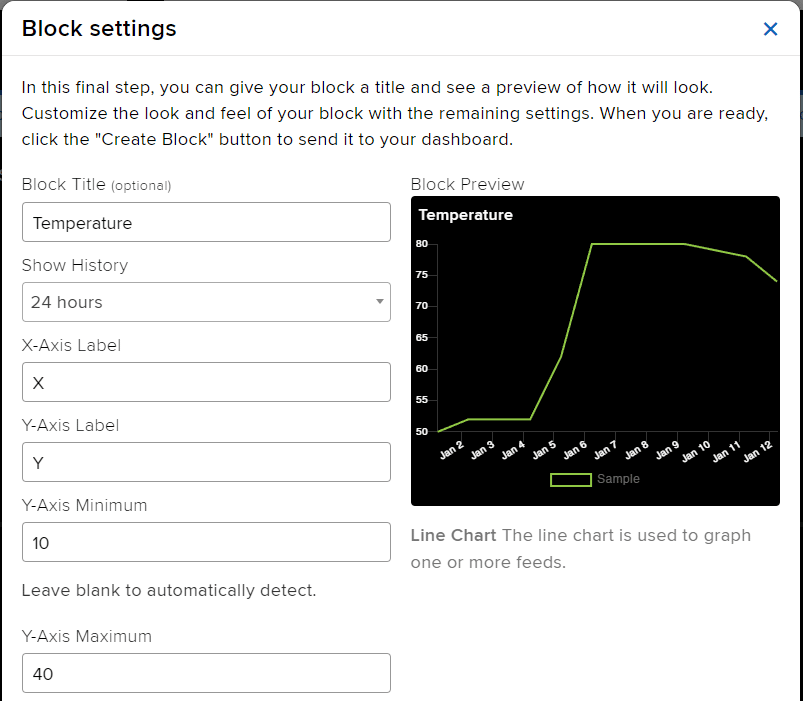
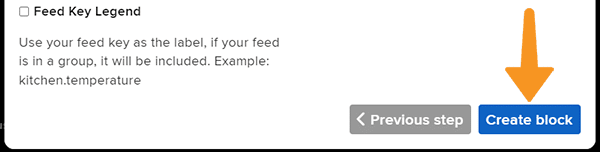
- Add the Block Title and the Y-Axis Minimum – Maximum value. Click on Create Block.
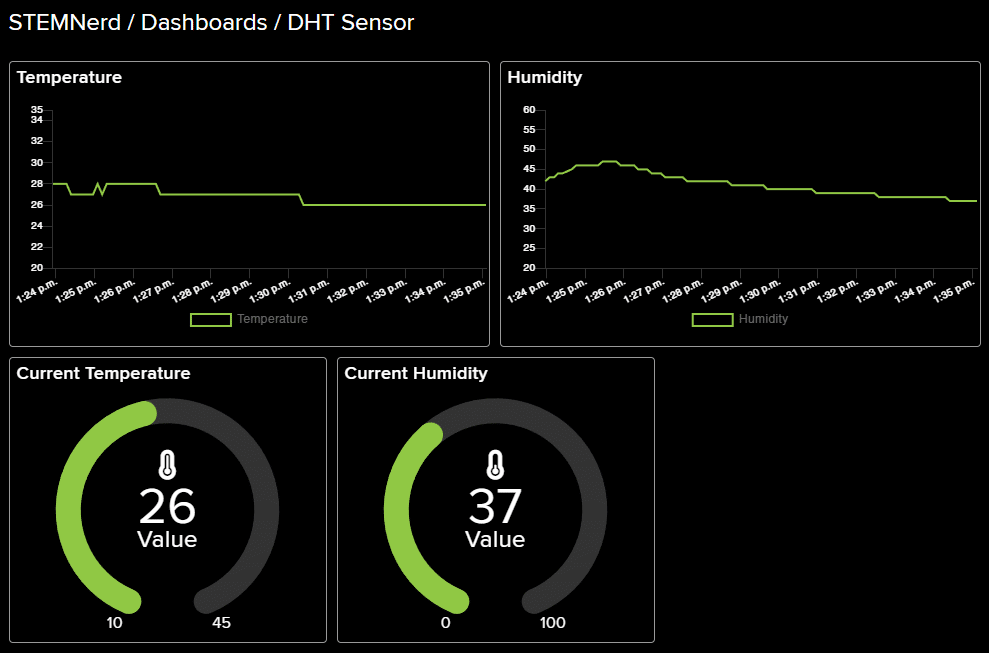
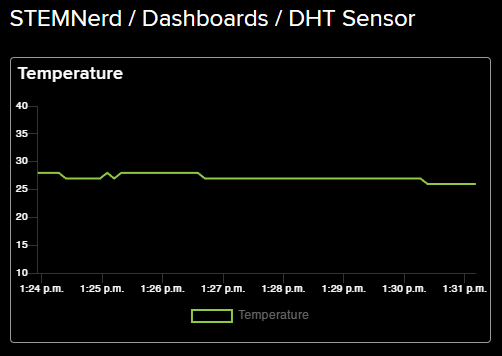
- You will find the block added on the dashboard.
- Add a Humidity block as well. Also, add two gauge elements showing the current temperature and humidity value.
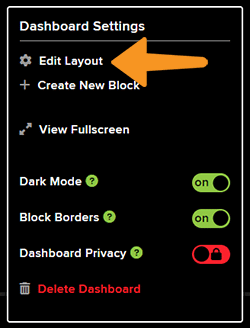
- Click on the Setting button and Edit Layout to align all the buttons.