



Introduction
Weather stations are incredibly useful monitoring systems used everywhere from local farming fields to advanced meteorological centers to keep track of changing environmental conditions! Learn what environmental sensors are, how data logging works, how to interface key weather monitoring sensors with evive, and program them with ease in PictoBlox – our blocks-based graphical programming platform with advanced hardware interaction abilities. Once you’re equipped with the basic knowledge of measuring atmospheric variables, tracking sensor thresholds, and displaying real-time data, we’ll show you how to build a fully functional home weather monitor and other exciting DIY climate-tracking projects using the components available in the evive Starter Kit.
To work in PictoBlox, you’ll first need to download it from HERE.
Ready? Set. Go!
Prerequisites
- Arduino Uno R3 Board
- Breadboard
- Laptop or Computer
- PictoBlox installed on the system
- Jumper Wires
How to Connect with Arduino Uno
- Connect Uno to your computer and open PictoBlox Embedded C++ Editor.
- In PictoBlox, go to the toolbar and click on the Board menu. Select Arduino Uno.
- Next, click on the Connect button, select the Port to which Arduino Uno is connected e.g. COMXX or ttyXX. Once you select the port, the icon beside the Connect tab will become connected.
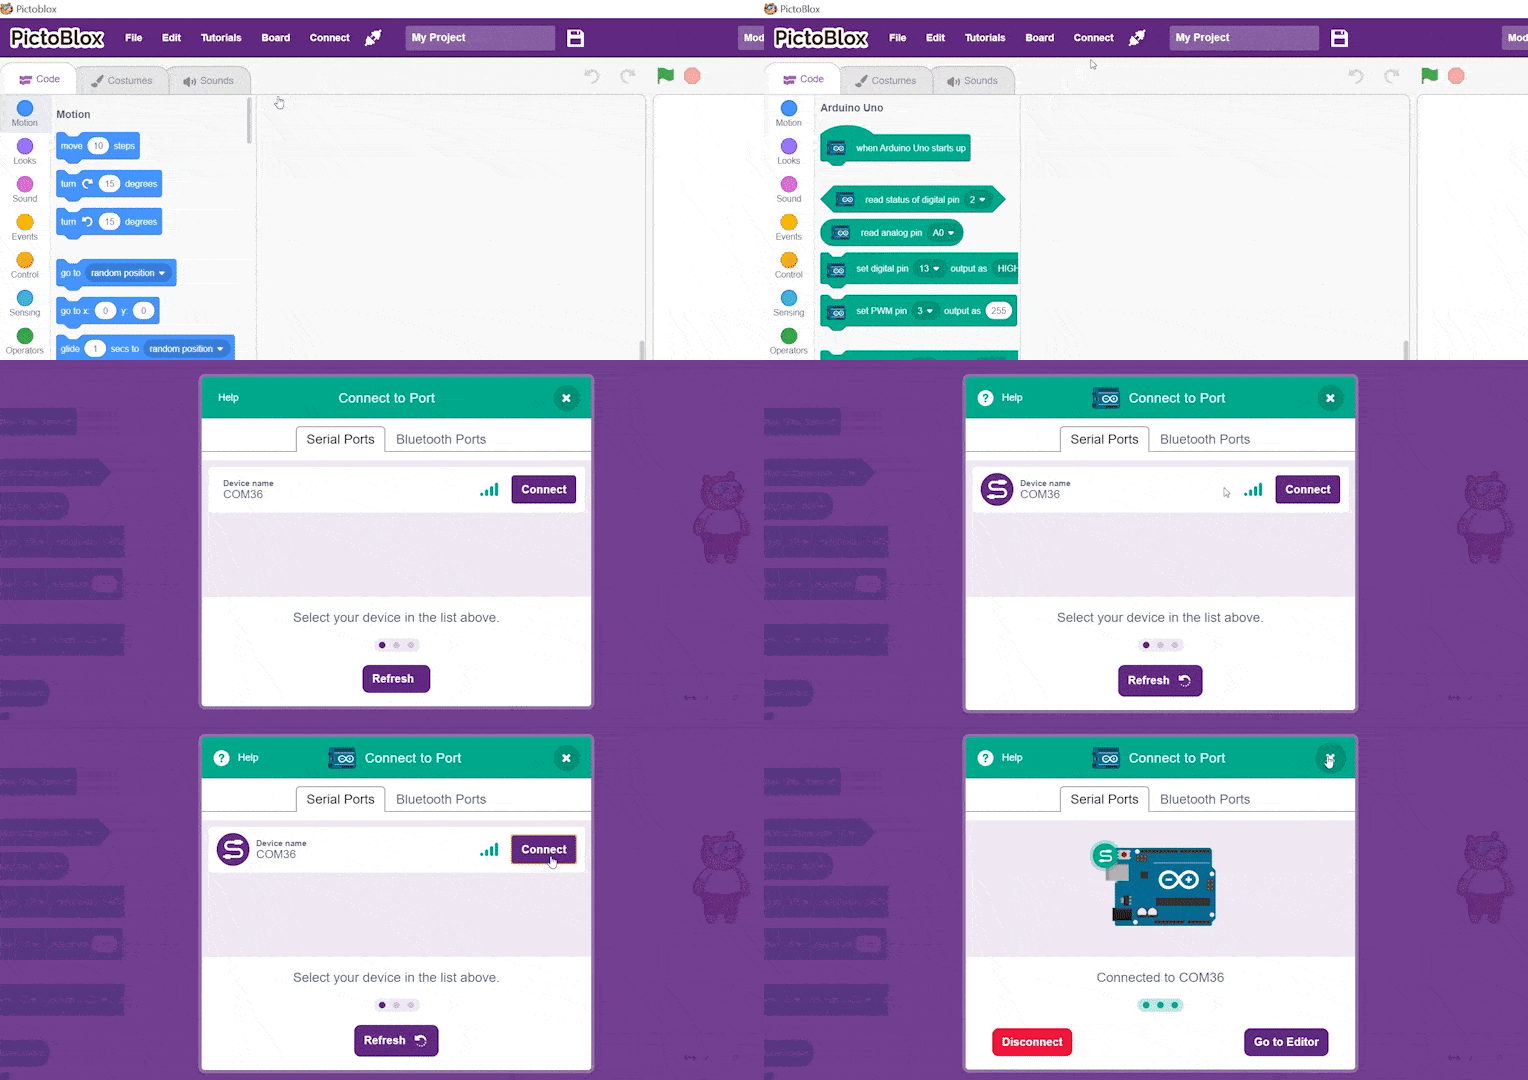
- On the top right corner, there is a toggle button named Mode. This button is used to switch between the two working modes of PictoBlox, namely the stage mode and the upload mode.
- Switch to Upload mode by toggling this button. You’ll observe some changes in the UI.
Connection Diagram
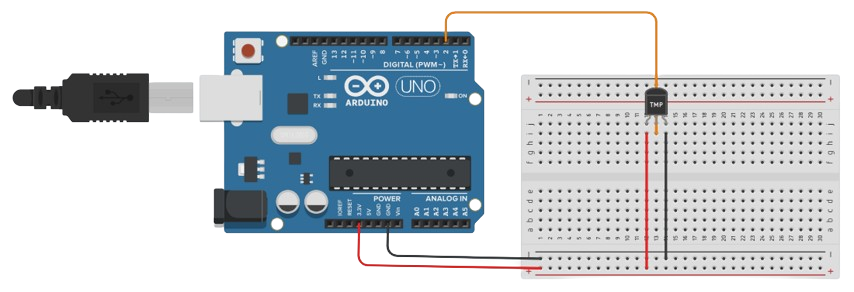
DHT 11 Connection
- Connect the Power Pin of the Sensor to 3.3V from Arduino Uno.
- Connect the GND Pin of the Sensor to GND from Arduino Uno.
- Connect the Vout of the Sensor to Digital PWM Pin 2 of Arduino Uno.
Code for Upload Mode
#include <DHT.h>

#define DHTPIN 2        // DHT11 data pin connected to digital pin 2
#define DHTTYPE DHT11   // Define sensor type

DHT dht(DHTPIN, DHTTYPE);

void setup() {
  Serial.begin(9600);
  dht.begin();
  Serial.println("DHT11 Sensor Test");
}

void loop() {
  float temp = dht.readTemperature();   // Temperature in °C
  float hum  = dht.readHumidity();      // Humidity in %

  // Check if reading failed
  if (isnan(temp) || isnan(hum)) {
    Serial.println("Failed to read from DHT11 sensor!");
    delay(1000);
    return;
  }

  // Print values
  Serial.print(temp);
  Serial.print(',');
  Serial.println(hum);

  delay(1000); // Wait 1 seconds between readings
}
To upload the code, click on the Upload Code button in bottom right corner.
Output
Conclusion
In this lesson, we learned how to build a real-time environmental monitoring system by interfacing a DHT11 temperature and humidity sensor with an Arduino board and programming it using PictoBlox. We explored how to use the functions to read precise atmospheric data and display the temperature and humidity values directly on PictoBlox’s Terminal. Through this hands-on project, we gained a solid understanding of how digital sensors transmit environmental variables and how to parse that raw data into readable metrics.