

The Graph Extension provides built-in tools for visualizing data during program execution. Users can:
- Plot variables and sensor readings in real time
- Identify trends, relationships, and patterns
- Observe system behavior dynamically
It integrates with PictoBlox tables as a data source. Tables must exist before plotting, either entered manually, imported from a CSV file, or generated dynamically during execution.
Accessing Graph Extension
Follow these steps to add the Graph Extension to your PictoBlox project:
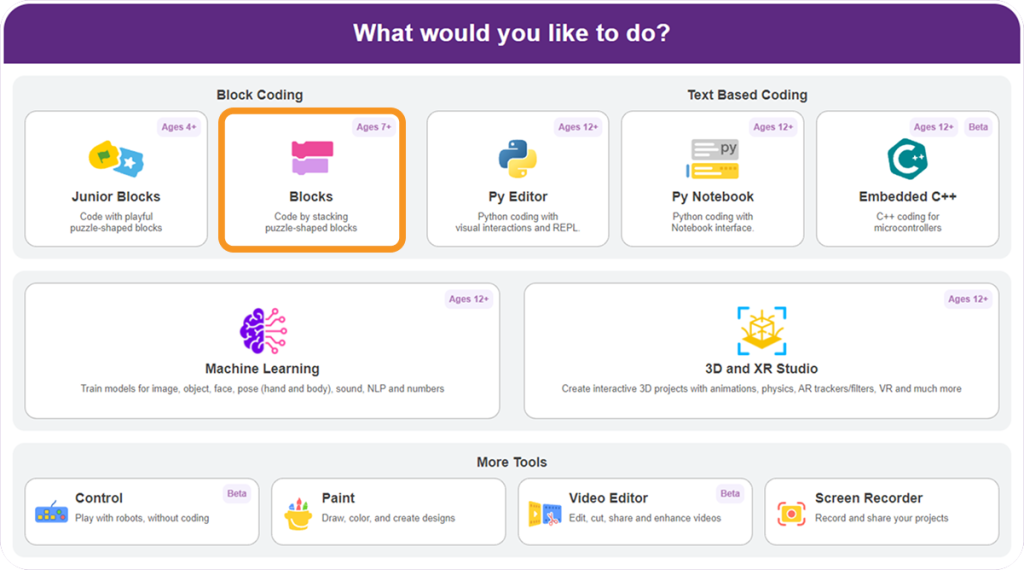
Step 1: Open PictoBlox and select the Block Coding environment.
Step 2: Click on Add Extension from the Blocks Palette.
Step 3: Search Graph and select the Graph Creation extension.
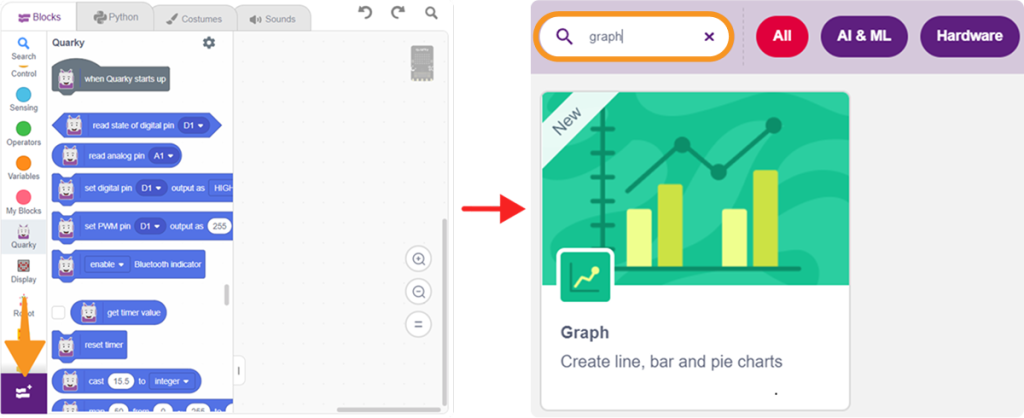
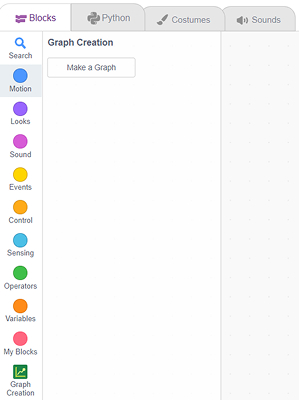
Step 4: The Graph blocks will now appear in the Blocks Palette under the Graph category and are ready to use.
Graph Extension Blocks
The PictoBlox Graph Extension provides intuitive blocks to visualize data from tables in real time. Below is a detailed explanation of each core block and its purpose.
1. Set Graph Type

- Determines the type of graph to display on the stage.
- Options:
line,bar,pie,scatter. - Guides how data trends, comparisons, proportions, or relationships are visualized.
2. Assign X-Axis Column

- Assigns the column to be displayed along the horizontal axis.
- Example: Use
Gradeto display class grades along the x-axis.
3. Plot Data Column

- Plots the selected column data on the graph.
- The color option defines the visual color of bars, lines, or points.
- Example: Plots the number of students in each grade using purple bars.
4. Show Gridlines

- Displays gridlines to make reading values easier.
- Helps interpret data points and trends visually.
5. Clear Graph

- Clears all existing data from the graph.
- Useful when dynamically updating the graph with new data during program execution.
6. Display Graph on Stage

- Makes the graph visible on the PictoBlox stage.
- Ensures students or viewers can see the plotted data after configuration.
7. Save Graph as Image

- Exports the graph as an image file.
- Useful for reports, presentations, or external sharing of results.
Table Creation in PictoBlox
Before plotting a graph, you need a data table. PictoBlox supports two methods for creating and populating tables.
Creating a Table Manually
A table in PictoBlox stores rows and columns of data similar to a spreadsheet. Each table has a name, and each column has a heading. Follow these steps to create a table manually.
Step 1: In the Block Coding environment, go to the Variables category in the Blocks Palette.
Step 2: Click Make a Table. A dialogue box will appear.
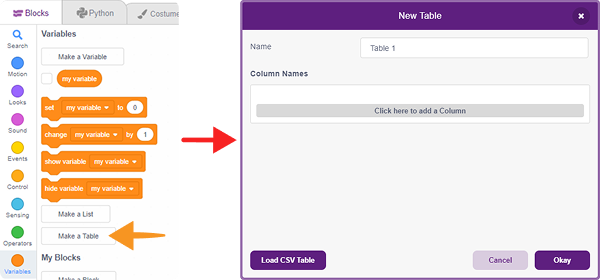
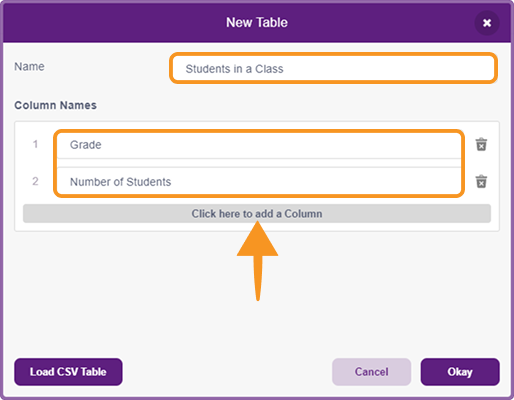
Step 3: Enter a Name for your table (for example, Students in a Class).
Step 4: Add Column Names with the help of Click here to add Column. (for example, Grade and Number of Students) and click OK.
Step 5: The table will appear on the stage.
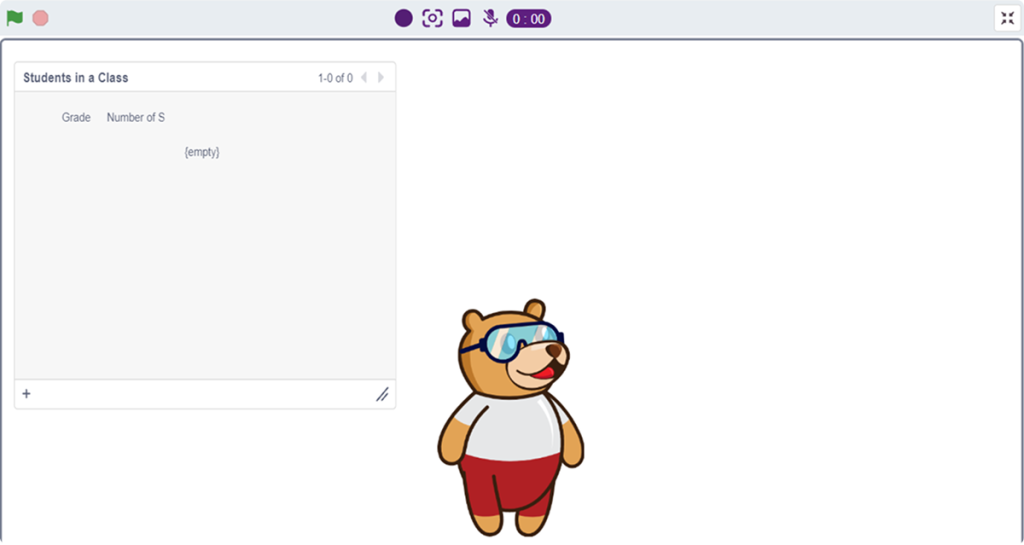
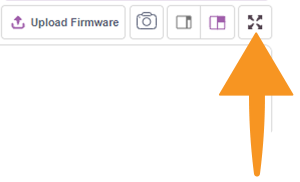
Step 6: To edit the table manually, click the Maximize Screen button in PictoBlox to view the table clearly.
Step 7: Use the + icon in the table to add rows of data.
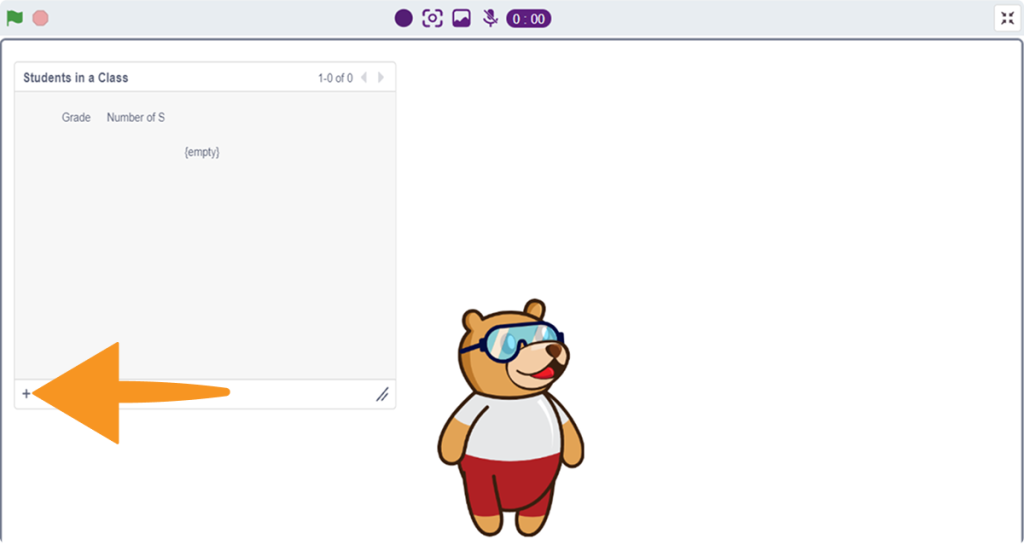
Step 8: Enter the required values in each column one by one to complete the table.
Importing a Table from a CSV File
PictoBlox allows you to import existing data directly from a CSV file into a table useful when working with real-world datasets. Follow these steps to import a table from a CSV File.
Step 1: In the Block Coding environment, go to the Variables category in the Blocks Palette.
Step 2: Click Make a Table. A dialogue box will appear.
Step 3: Enter a Name for your table (for example, Students in a Class) and click on Load CSV Table.
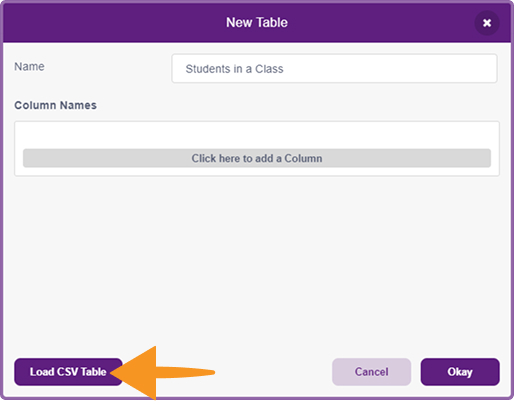
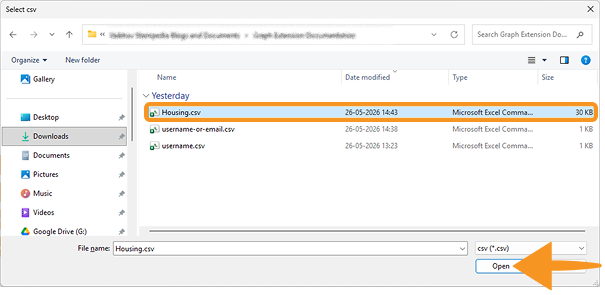
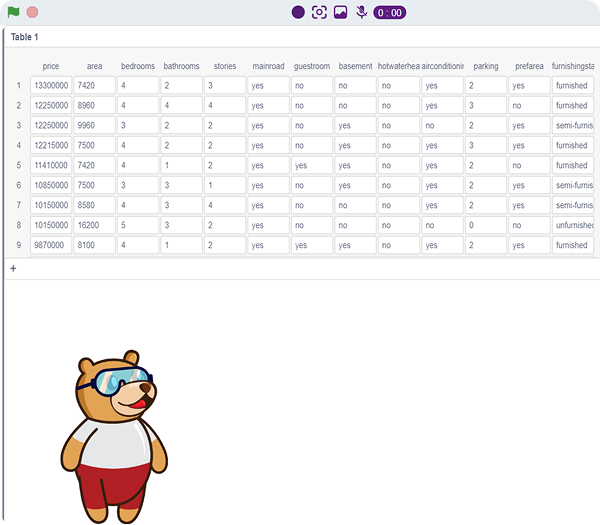
Step 4: Select your CSV file from your computer, then click Open. PictoBlox will automatically read the column headers and populate the rows.
Step 5: The table is now ready to use with graph blocks.
Creating a Bar Graph Using Graph Extension
In this section, you will learn how to create a dynamic graph using the Graph Extension in PictoBlox. The graph will visually represent the data entered in a table, allowing students to see relationships, trends, and patterns in real time. By following this process, you will connect table data to a graphical output on the stage, reinforcing both coding and data visualization concepts in a hands-on, interactive manner.
Creating a Table Manually in PictoBlox
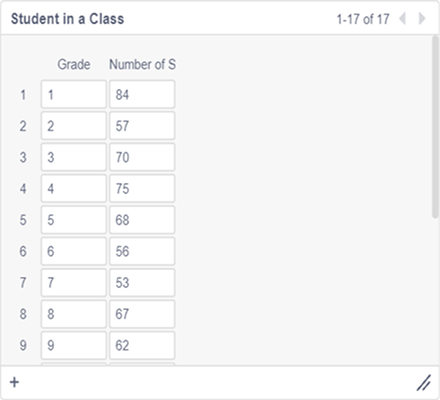
Step 1: Before plotting any graph, you need a data table. The table acts as the data source for the graph. Follow the steps in the Creating Table Manually section above to create a table named Student in a Class and add two columns.
- Grade
- Number of Students
Step 2: Use the + icon in the table to add rows of data.
Step 3: Enter the required values in each column one by one to complete the table.
For this example, enter the Grade number in the first column and the corresponding Number of Students in the second column.
Your completed table should look like this:
Adding the Graph Extension
Once the table is ready, add the Graph extension to your project. Follow the steps in the Accessing Graph Extension section above to access the Graph Extension in PictoBlox:
Creating a Graph Using “Make a Graph”
The Graph Extension provides a built-in Make a Graph option that lets you visually configure your graph before writing any code.
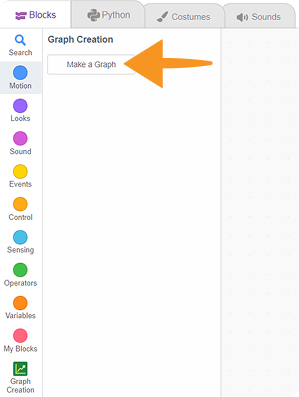
Step 1: In the Graph section of the Blocks Palette, click Make a Graph. A New Graph dialogue box will open.
Step 2: In the Name field, enter a name for your graph: Bar Graph of Students in each Class.
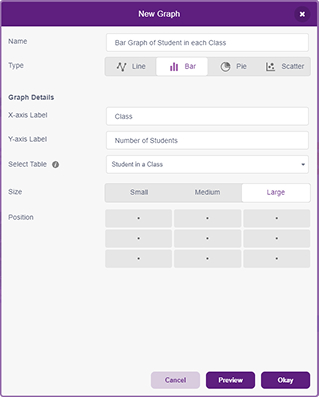
Step 3: Select the graph type. The Graph Extension supports four types:
| Graph Type | Best Used For |
| Line | Showing trends over time or continuous data |
| Bar | Comparing values across categories |
| Pie | Showing proportions or percentages of a whole |
| Scatter | Showing relationships between two variables |
For this example, select Bar.
Step 4: Under Graph Details, fill in the following:
- X-axis Label: Class
- Y-axis Label: Number of Students
- Select Table: Choose Student in a Class from the dropdown — this links the graph to your data table.
Step 5: Choose the Size of the graph on the stage. Options are Small, Medium, and Large. For this example, select Large for a clear, full view.
Step 6: Choose the Position of the graph on the stage using the 3×3 position grid. Select the position that best fits your stage layout.
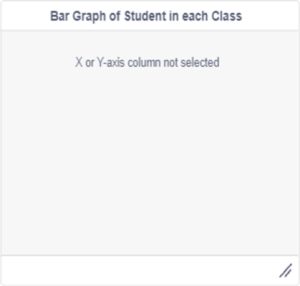
Step 7: Click Preview to see how your graph will look before confirming.
Step 8: Click Okay to save the graph configuration. Your graph object, Bar Graph of Students in each Class, is now created and ready to be used in block coding.
Writing the Block Code
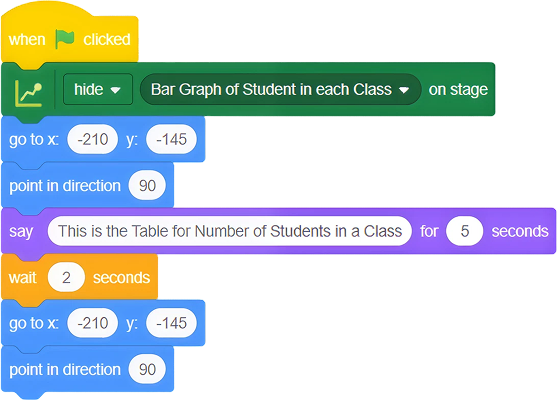
Now write the block coding script to display the table and graph on the stage when the program runs.
Step 1: Add the when green flag clicked block from Events to begin the program. This triggers the entire script as soon as the green flag is clicked on the PictoBlox stage.
Step 2: Add the hide [Bar Graph of Students in each Class] on the stage block from Graph so the graph remains hidden at the beginning. This ensures the data table is shown to the viewer first before the graph appears.
Step 3: Add the go to x: [-210] y: [-145] block from Motion to place the bear sprite at its correct starting position on the stage.
Then add the point in direction [90] block from Motion to make the sprite face the right direction before the program begins displaying information.
Step 4: Add the say [This is the Table for Number of Students in a Class] for [5] seconds block from Looks so the bear sprite announces to the viewer that the data table is now visible on the stage.
Then add the wait [2] seconds block from Control to pause the program for 2 seconds, giving the viewer time to read the table before the graph is shown.
Step 5: Add the go to x: [-210] y: [-145] block from Motion again to keep the sprite in its correct position on the stage for the graph announcement phase.
Then add the point in direction [90] block from Motion to maintain the sprite’s facing direction before the graph blocks run.
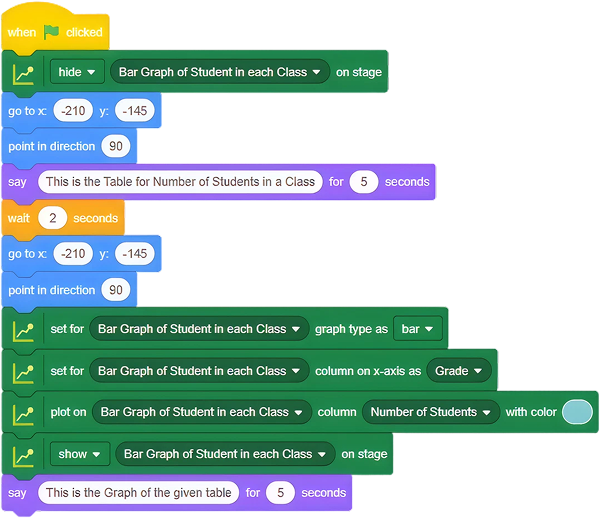
Step 6: Add the set for [Bar Graph of Students in each Class] graph type as [bar] block from Graph to tell PictoBlox that this graph should be rendered as a bar chart on the stage.
Step 7: Add the set for [Bar Graph of Students in each Class] column on x-axis as [Grade] block from Graph to assign the Grade column from the Student in a Class table as the x-axis of the graph. Each grade number will appear along the bottom of the graph.
Step 8: Add the plot on [Bar Graph of Students in each Class] column [Number of Students] with color [] block from Graph to plot the Number of Students column as the y-axis data. Each bar in the graph will represent the number of students for a particular class grade, displayed in teal colour.
Step 9: Add the show [Bar Graph of Students in each Class] on stage block from Graph to make the fully configured bar graph appear on the right side of the PictoBlox stage. The graph will render immediately using the data from the Student in a Class table.
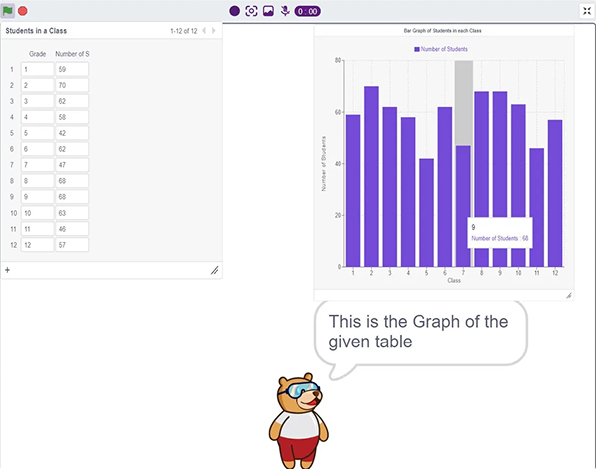
Step 10: Add the say [This is the Graph of the given table] for [5] seconds block from Looks so the Tobi sprite announces that the graph is now visible on the stage. The speech bubble will appear for 5 seconds before disappearing.
Complete Block Script
Output on the PictoBlox Stage
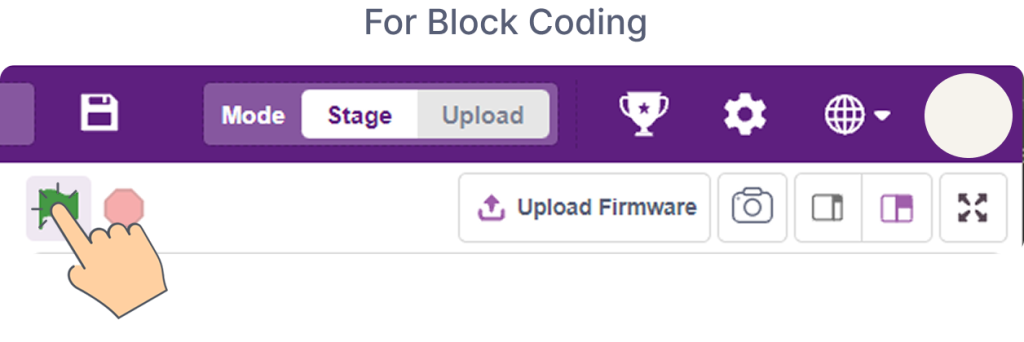
Click the Green Flag in Block Coding to run the program.
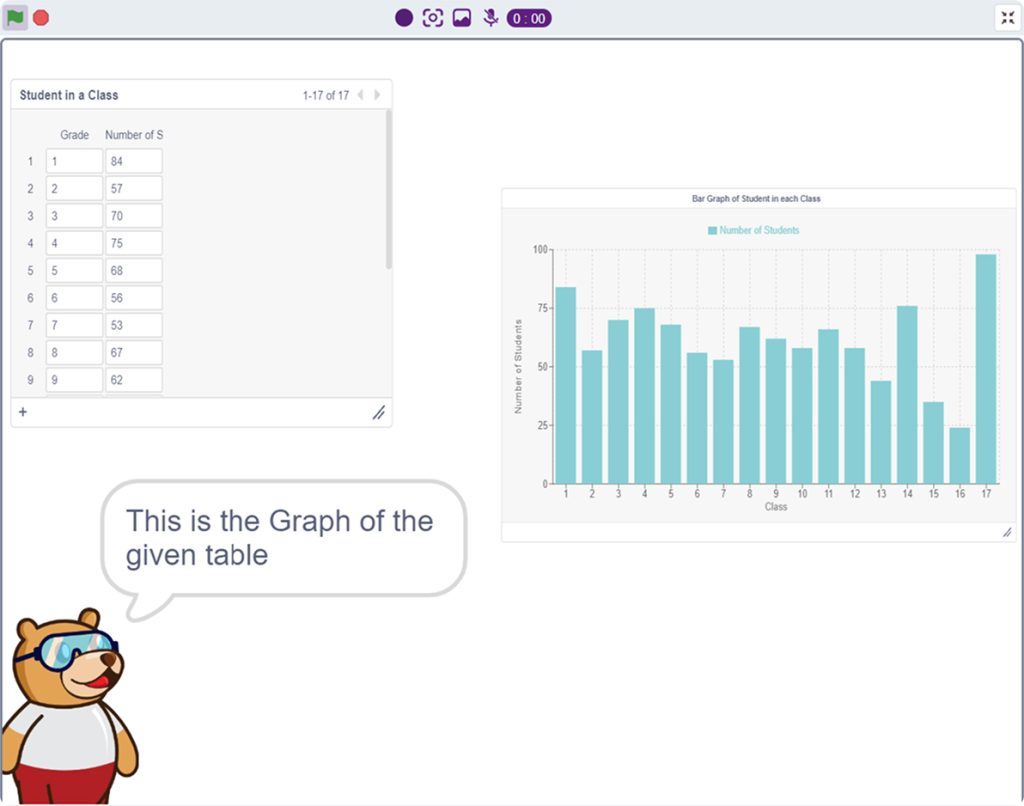
The PictoBlox stage displays the following result of the Bar Graph of Students in each Class.
Explore Built-in Example in PictoBlox
PictoBlox includes a ready-made example that demonstrates the Graph Extension in action. Follow the steps below to access and explore it.
Step 1: Open the Example.
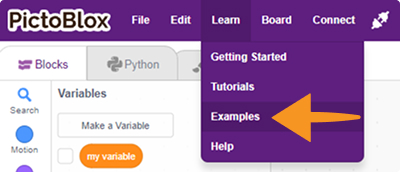
In PictoBlox, go to the Learn section from the top menu, navigate to Examples.
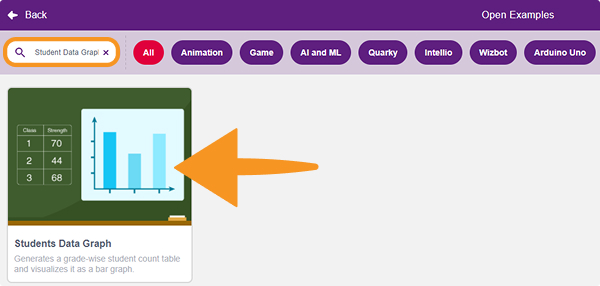
Search for Students Data Graph. Click on it to load the project.
Step 2: Explore the Block Code.
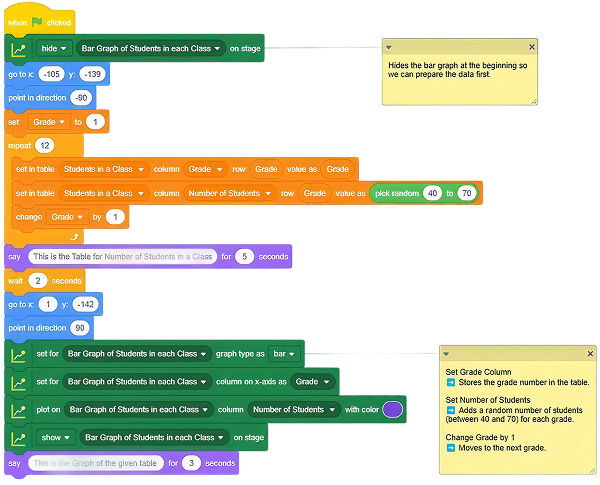
Once the example loads, you will find a pre-built block coding script ready to run. The script uses a repeat block from Control to automatically fill the Students in a Class table with 12 rows of data, assigning Grade values from 1 to 12 and a random Number of Students between 40 and 70 for each grade using the pick random [40] to [70] block from Operators.
The script then configures and displays the Bar Graph of Students in each Class using the Graph blocks, setting the graph type as bar, assigning Grade as the x-axis column, and plotting Number of Students as the data series in purple colour.
Step 3: Run and View the Output.
Click the Green Flag in Block Coding to run the program.
The PictoBlox stage will display: