


Introduction
Have you ever wanted to learn Python — one of the most powerful and widely used programming languages in the world of artificial intelligence and data science? In this beginner-friendly project, we will explore the PictoBlox Python Notebook, an interactive Jupyter Notebook environment built right into PictoBlox. It is a Scratch-based graphical programming software designed to make AI and Python coding accessible and fun for students and young learners.
By the end of this hands-on STEM activity, you will understand five essential Python programming concepts — from variables and loops to data visualisation using Matplotlib — all without installing any external software. Let’s begin!
Step 1 Import the matplotlib library from PIP installer.
1. Introduction to Python
Python is one of the most popular programming languages in the world, powering everything from websites and mobile apps to artificial intelligence, machine learning models, and robotics. It is known for being easy to read and write – making it the perfect first language for students who want to enter the exciting world of AI and computational thinking.
In PictoBlox’s Python Notebook, you can write Python code directly in interactive cells and run them instantly to see the output. Let’s start with a simple example.
Code Example – Your First Python Program
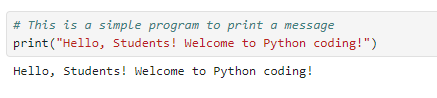
The print() function is one of the most fundamental tools in Python. It outputs any text or value to the screen. This is how every Python programmer tests their code!
2. Variables and Data Types
In Python — and in the real world of AI and data science — variables are used to store information that your program can access and use at any time. Think of a variable as a labelled container: you put a value inside it and refer to it by name whenever you need it.
Python supports several important data types:
- String (str) — Text data, e.g., names, sentences
- Integer (int) — Whole numbers, e.g., age, count
- Float — Decimal numbers, e.g., scores, measurements
- Boolean — True or False values used in conditions
Code Example – Storing and Printing Variables
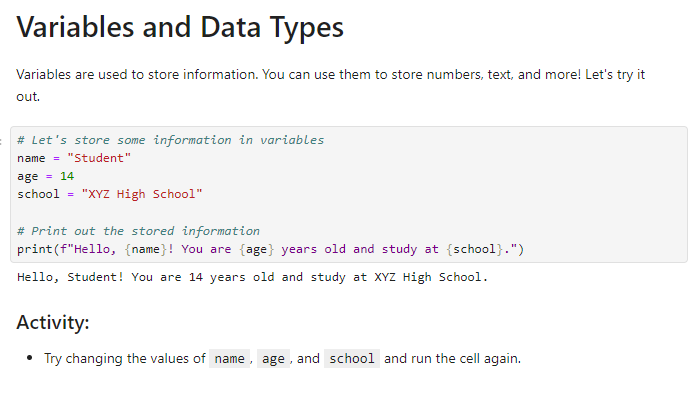
f-strings are a powerful Python feature that lets you insert variable values directly inside a string using curly braces {}. They are widely used in AI applications for generating dynamic text and reports.
3. Loops and Conditionals
Loops and conditionals are two of the most important concepts in programming and computational thinking. They allow your code to make decisions and repeat tasks automatically — just like how AI systems iterate over large datasets to find patterns and make predictions.
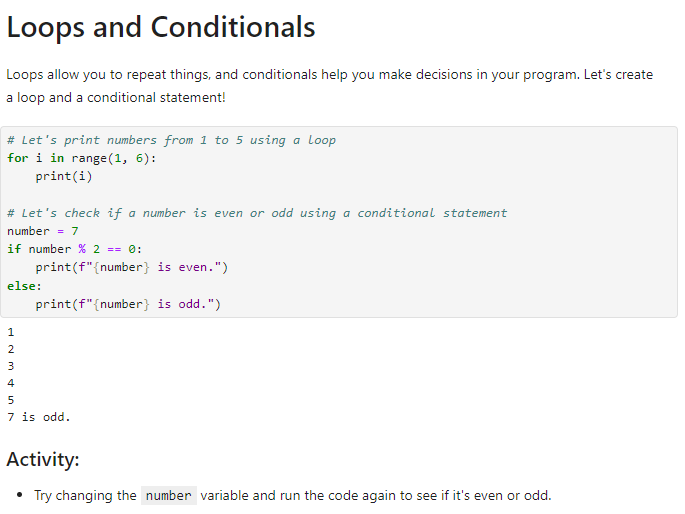
Loops – Repeating Actions Automatically
A for loop in Python lets you repeat a block of code a specific number of times. This is extremely useful in data science and machine learning, where algorithms often need to process thousands of data points in sequence.
4. Functions in Python
Functions are one of the most important building blocks of any programming language. A function is a reusable block of code that performs a specific task. Instead of writing the same code multiple times, you define it once as a function and call it whenever needed.
In artificial intelligence and software development, well-structured functions make code modular, readable, and easy to maintain — which is a key skill for future AI engineers and data scientists.
Code Example – Creating a Function
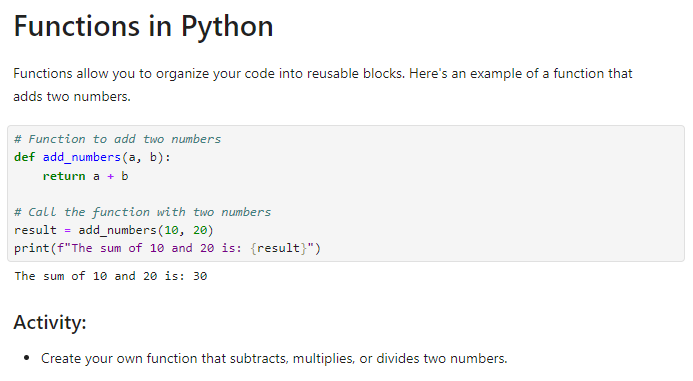
‘def’ is the Python keyword used to define a function. The return keyword sends the result back to wherever the function was called. Parameters like a and b allow you to pass different values each time.
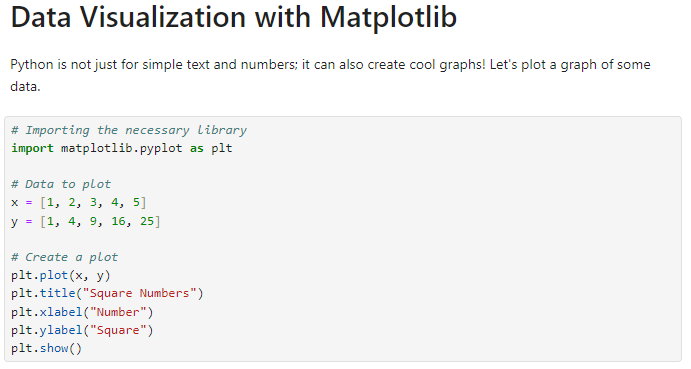
5. Data Visualization with Matplotlib
Python is not just for writing programs — it is also an incredibly powerful tool for data visualisation. In AI and machine learning, visualising data helps scientists and engineers understand trends, identify patterns, and make informed decisions.
Matplotlib is one of the most widely used Python libraries for creating charts and graphs. It is a foundational skill for anyone interested in data science, machine learning, or AI research.
Code Example – Plotting a Graph of Square Numbers
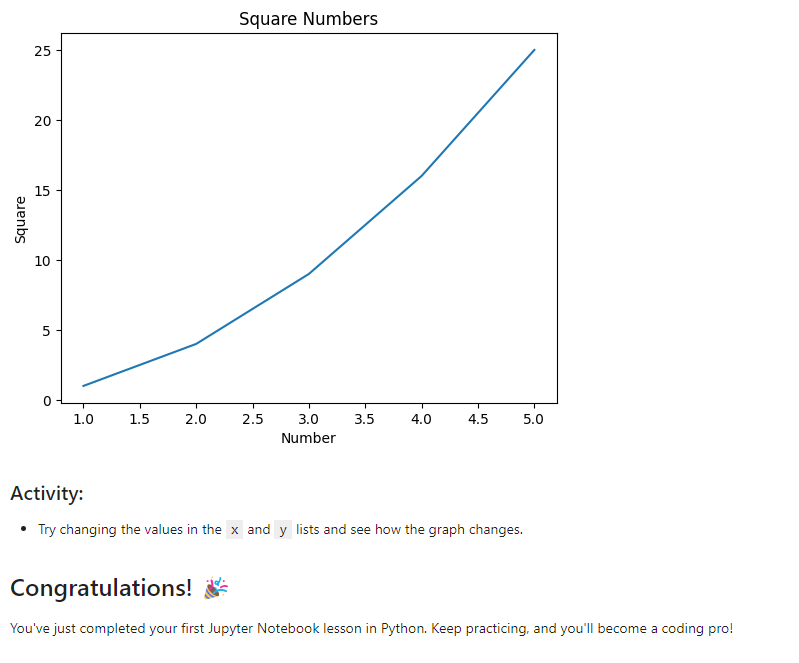
This code generates a smooth curve showing the relationship between numbers and their squares — a classic example of a quadratic (non-linear) trend. Understanding such patterns is fundamental to machine learning model training and data analysis.
Understanding the Graph
- X-axis (Number): Represents the input values from 1 to 5
- Y-axis (Square): Represents the squared values—1, 4, 9, 16, 25
- The upward curve confirms that as numbers increase, their squares grow much faster (exponential-like trend)
- plt.title(), plt.xlabel(), and plt.ylabel() are used to label the chart clearly — a must-have in professional data science
Conclusion
Congratulations! You have just completed your first Python notebook lesson in PictoBlox. In this project, you successfully:
- Wrote and ran your first Python program using the print() function
- Stored and displayed information using variables and f-strings
- Used for loops and if-else conditionals to automate decisions
- Defined and called a reusable Python function
- Created a data visualization graph using Matplotlib
These are not just beginner exercises — they are the exact same building blocks used by professional AI developers, data scientists, and software engineers every day. Keep practising, keep exploring, and you’ll be well on your way to becoming a coding pro!