


Introduction
In this example project we are going to explore how to create a Machine Learning Model which can count the number of nuts and bolts from the camera feed or images. You will learn how to open the ML environment, collect and upload data, label images, train the model, and export the Python script.
Object Detection in Machine Learning Environment
Object Detection is an extension of the ML environment that allows users to detect images and make bounding boxes into different classes. This feature is available only in the desktop version of PictoBlox for Windows, macOS, or Linux. As part of the Object Detection workflow, users can add classes, upload data, train the model, test the model, and export the model to the Block Coding Environment.
Opening Image Detection Workflow

Alert: The Machine Learning Environment for model creation is available in the only desktop version of PictoBlox for Windows, macOS, or Linux. It is not available in Web, Android, and iOS versions.
Follow the steps below:
- Open PictoBlox and create a new file.
- Select the Python Coding Environment.
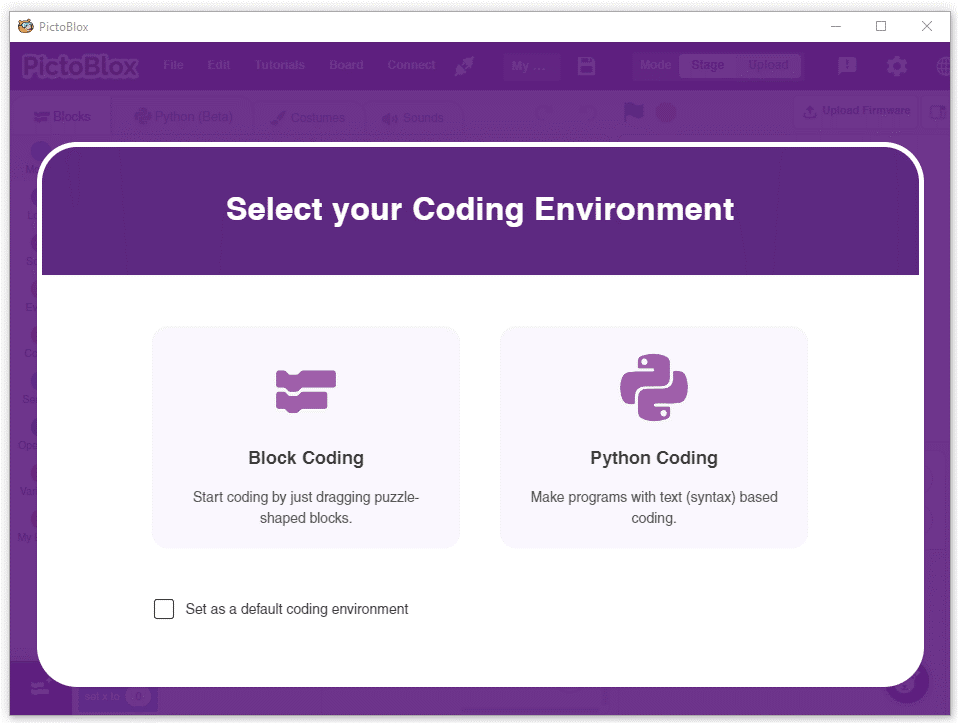
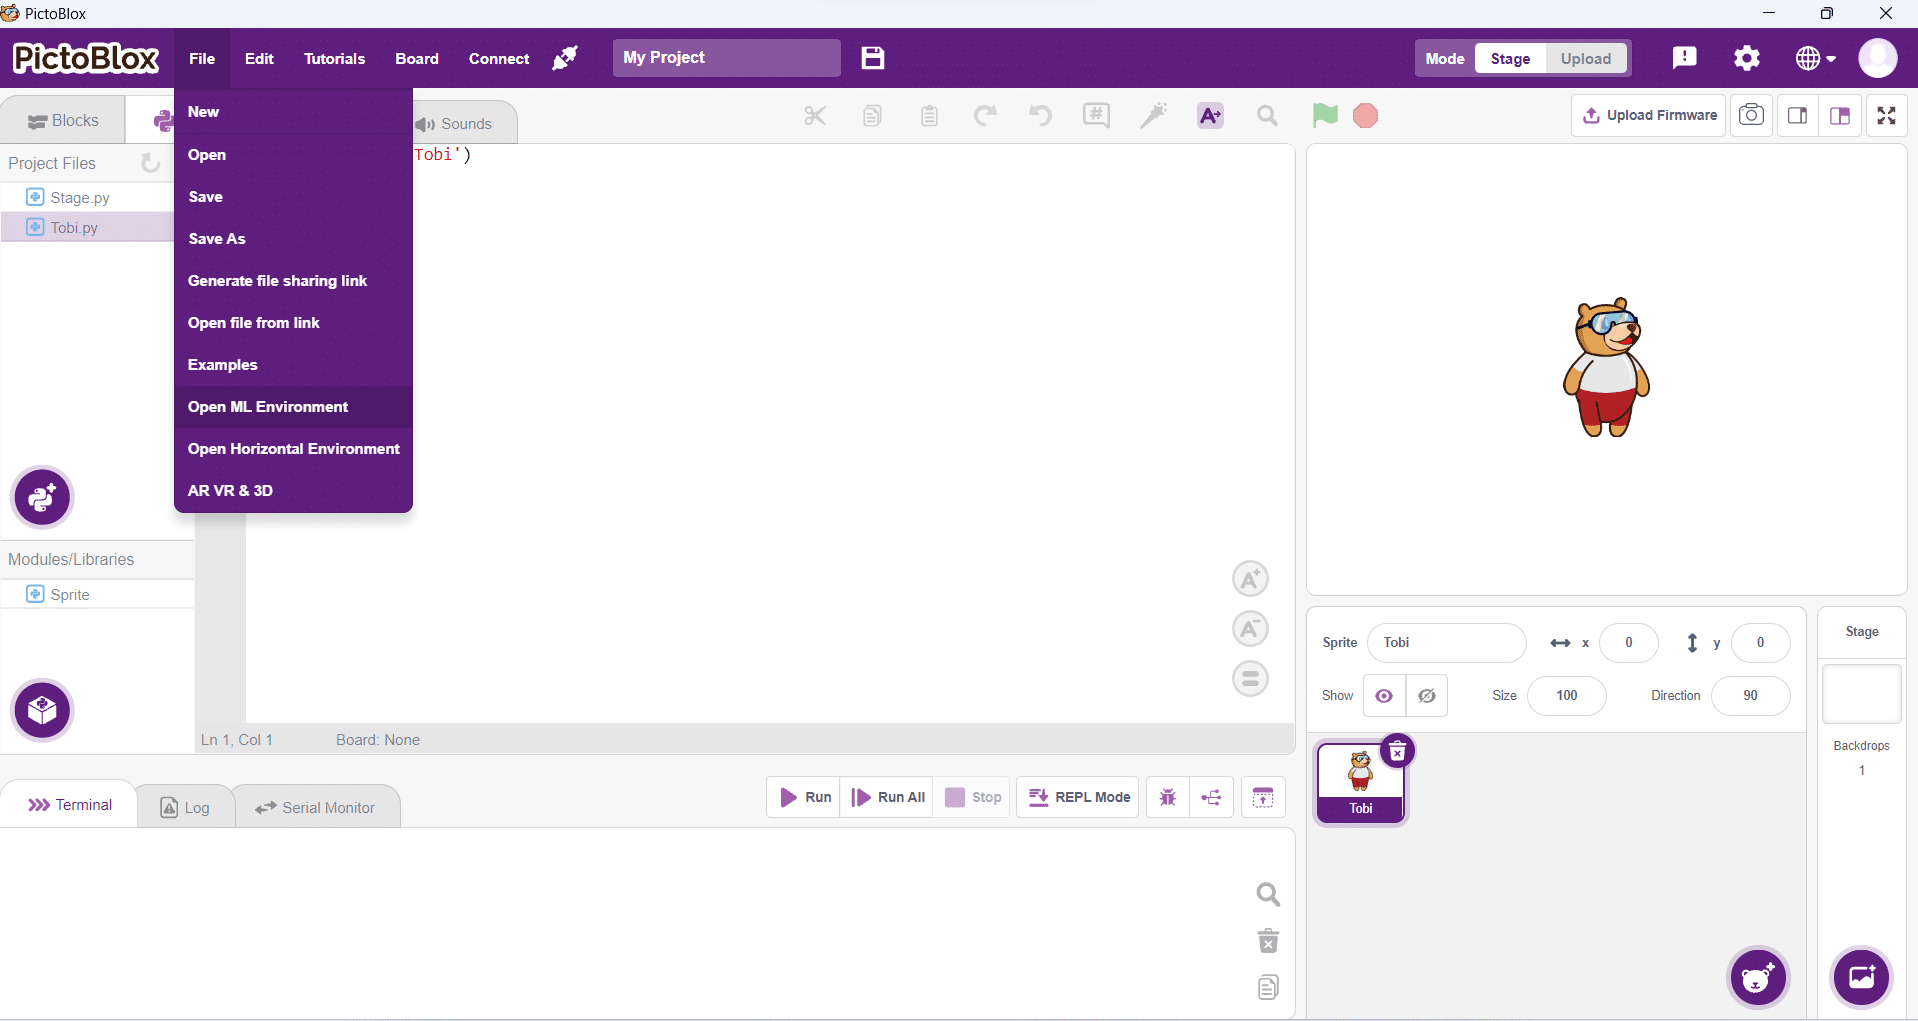
- Select the “Open ML Environment” option under the “Files” tab to access the ML Environment.
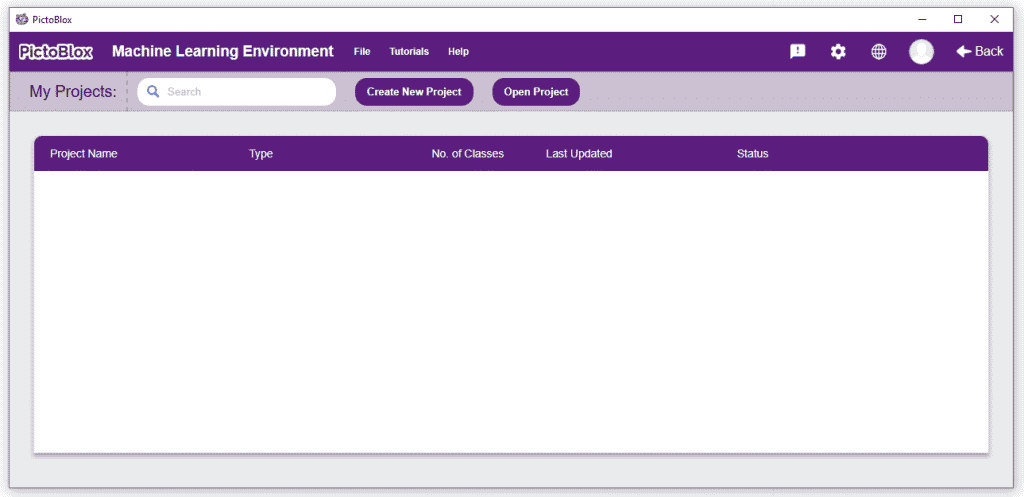
- You’ll be greeted with the following screen.
Click on “Create New Project”.
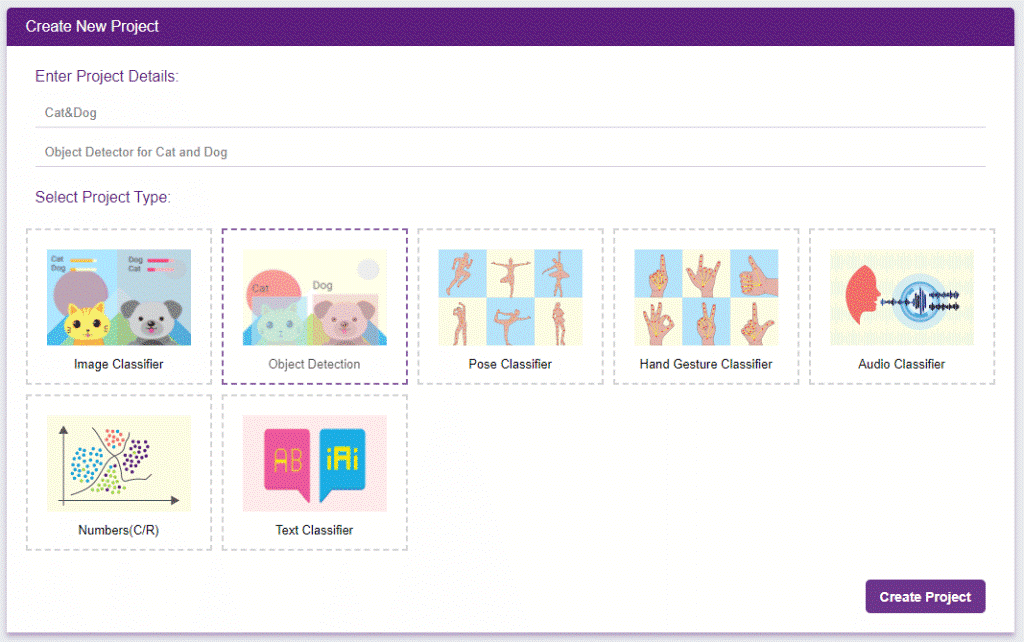
- A window will open. Type in a project name of your choice and select the “Object Detection” extension. Click the “Create Project” button to open the Object Detection window.
You shall see the Object Detection workflow. Your environment is all set.
Collecting and Uploading the Data
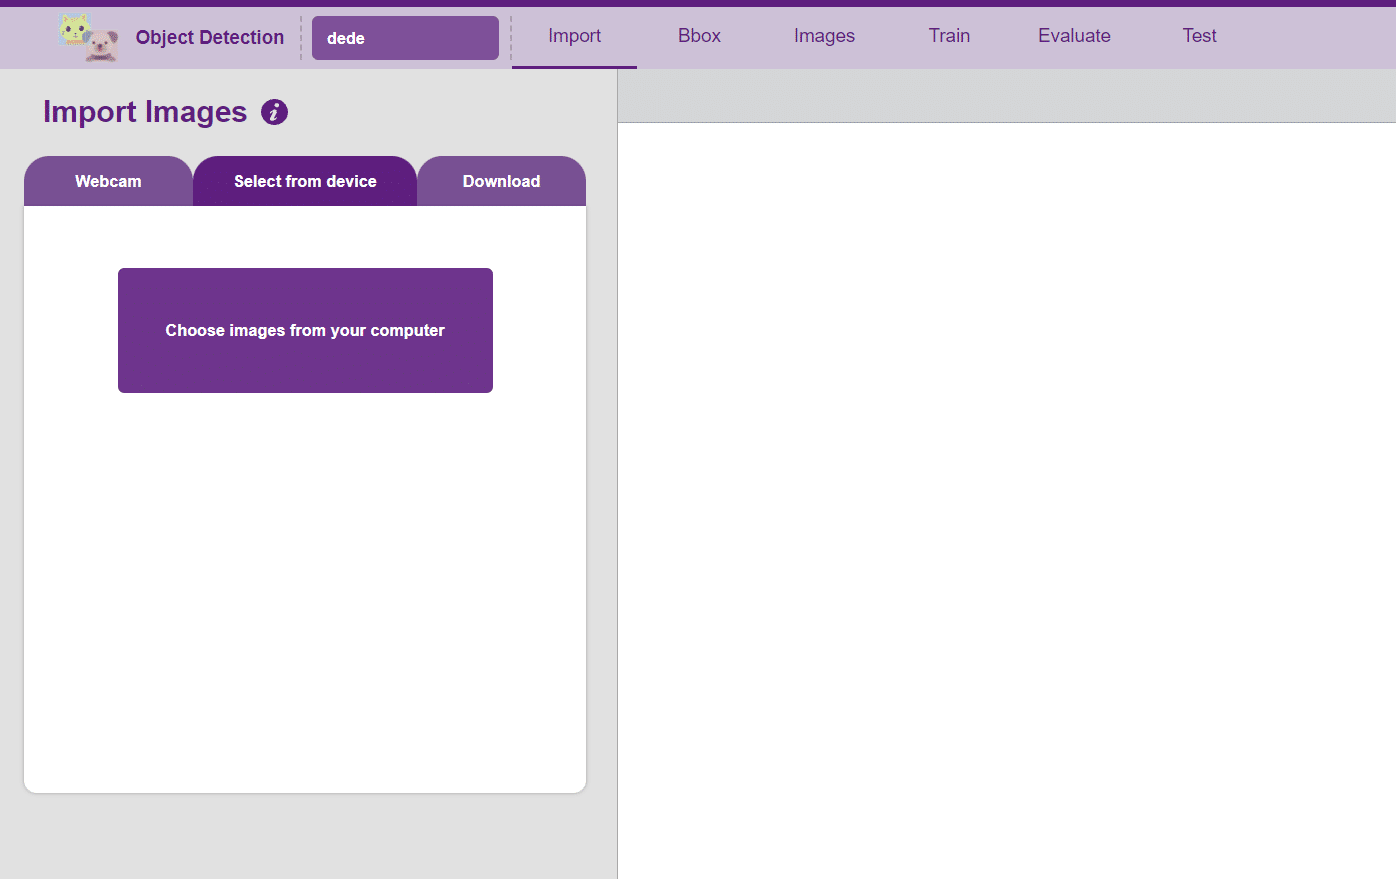
The left side panel will give you three options to gather images:
- Using the Webcam to capture images.
- Uploading images from your device’s hard drive.
- Downloading images from a repository of images.
Uploading images from your device’s hard drive
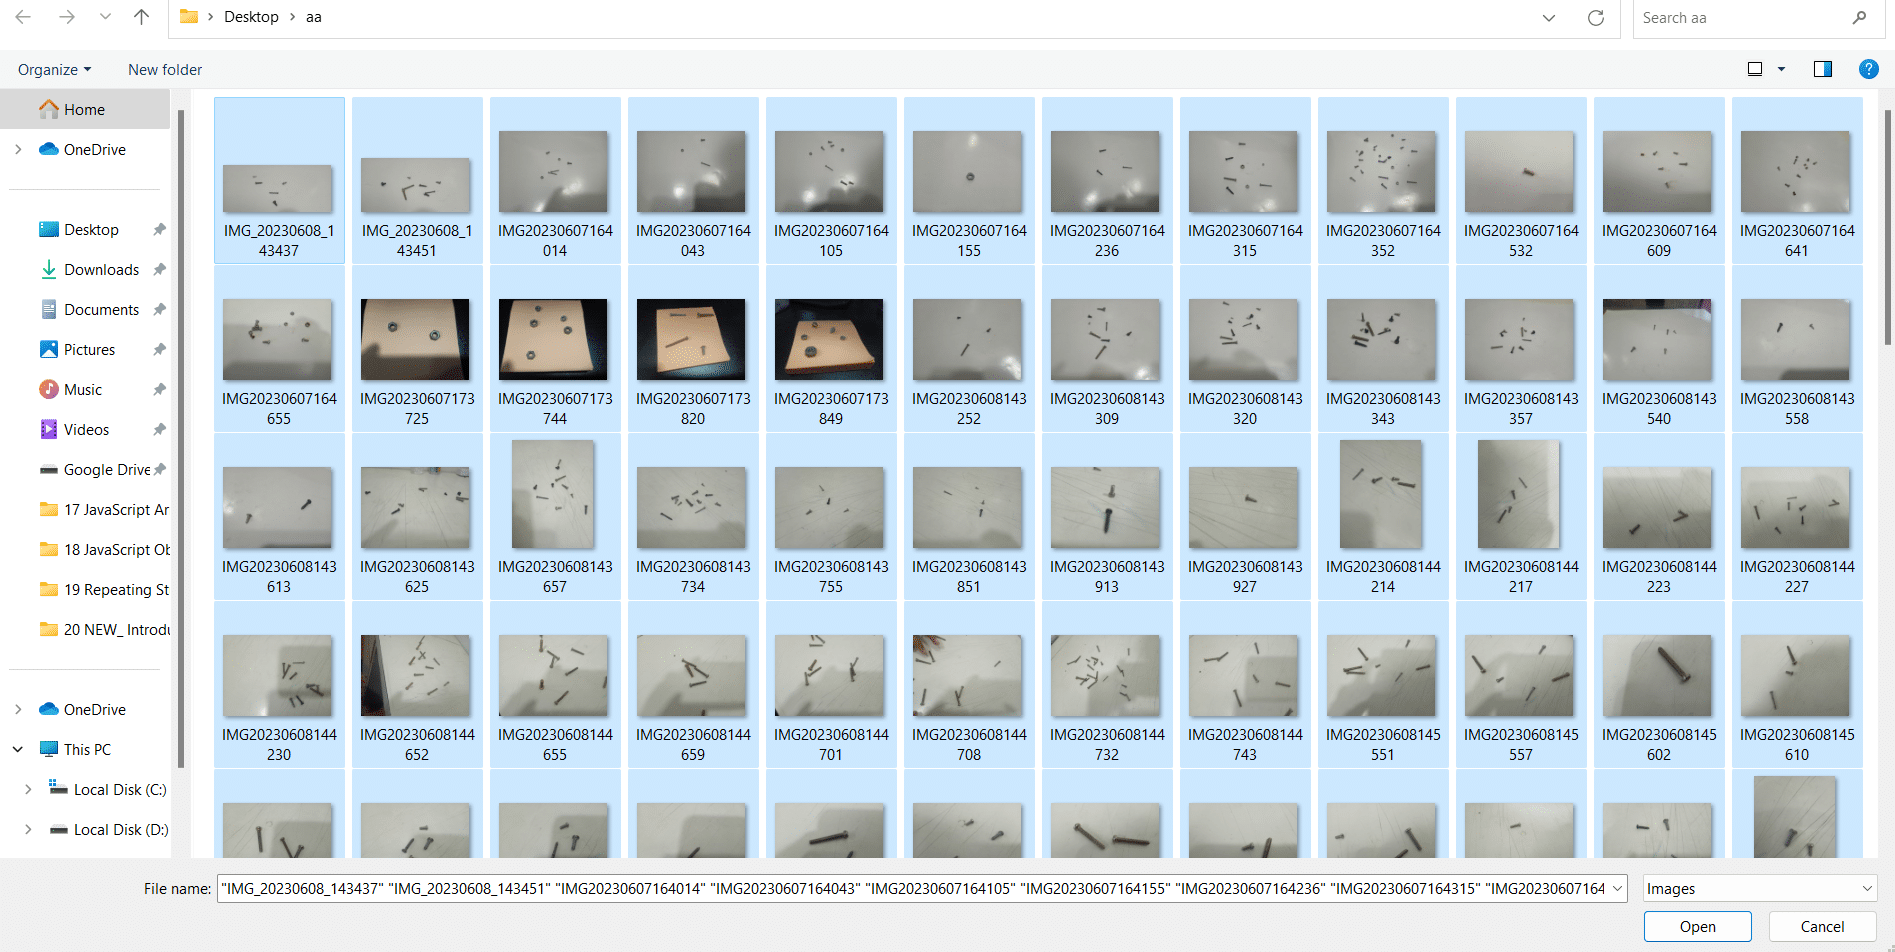
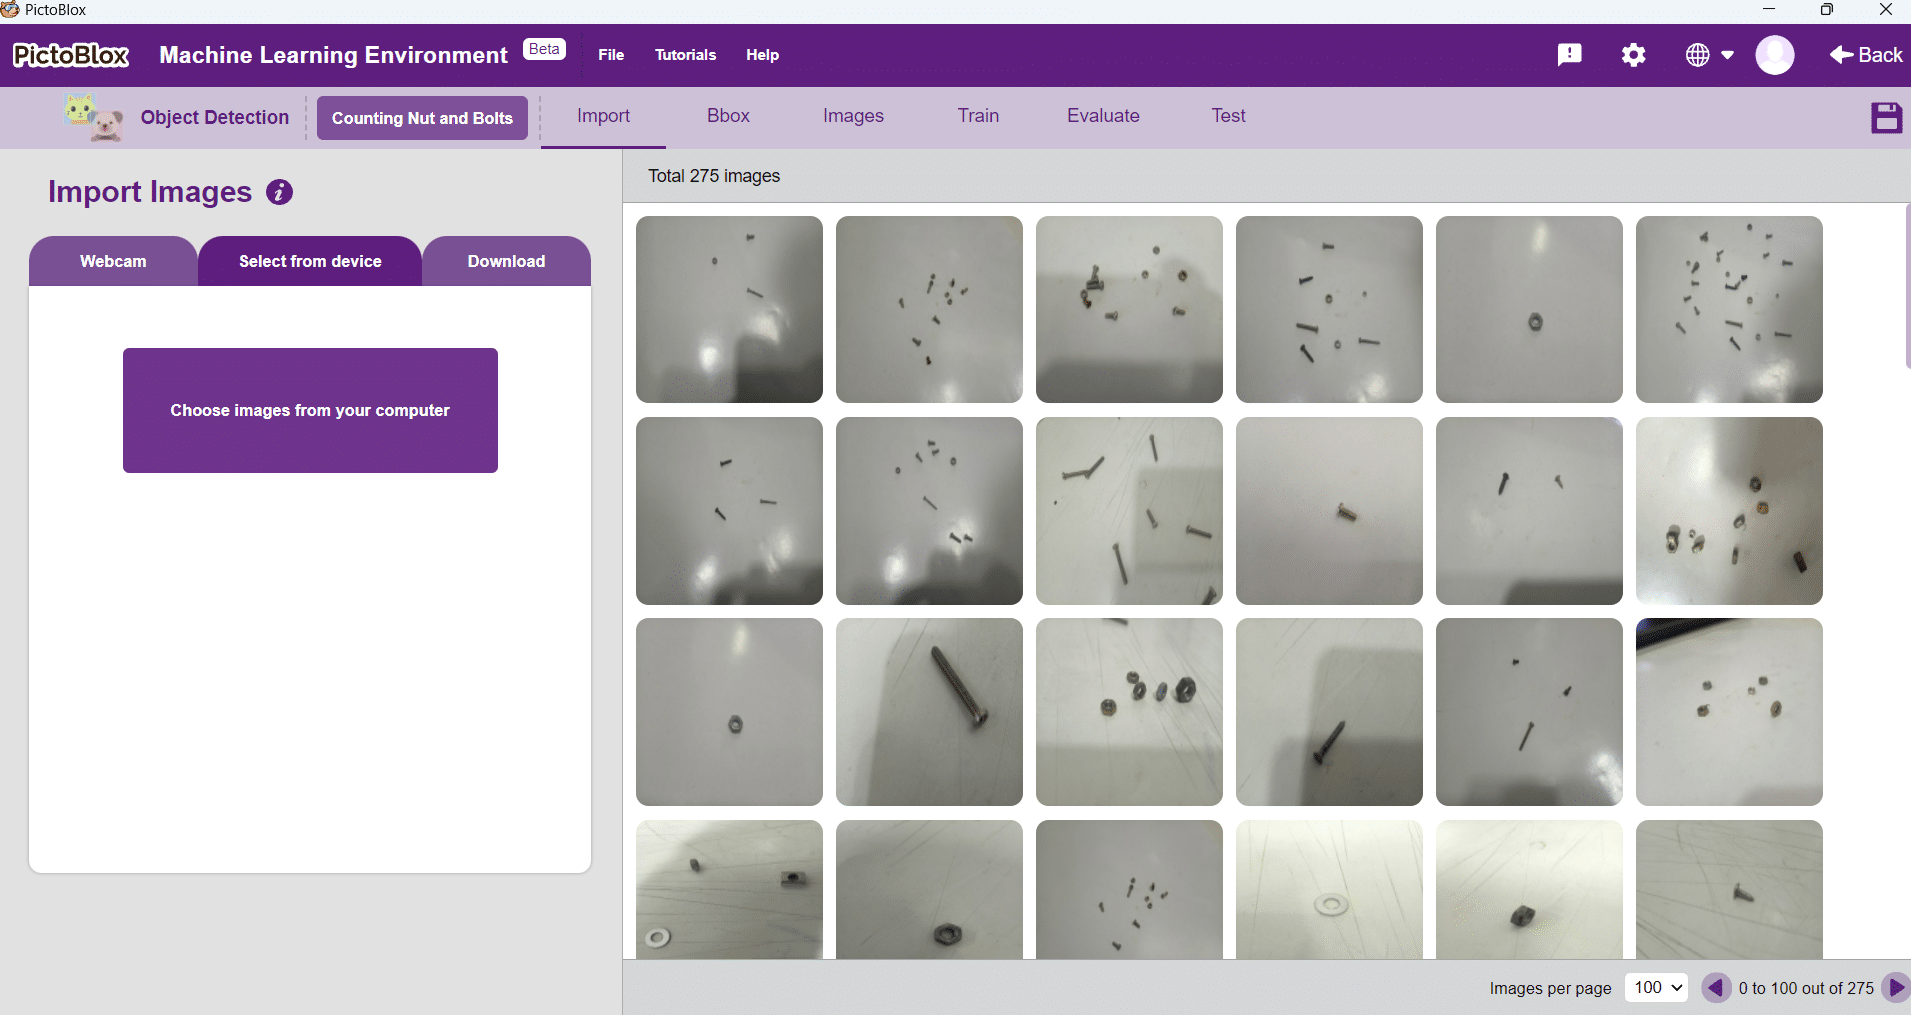
- Now it’s time to upload the images which you downloaded from another source or captured from your camera. Click on the “Select from device” option from the Import Images block.
- Now click on the “Choose images from your computer” and go to the folder where you downloaded your images.
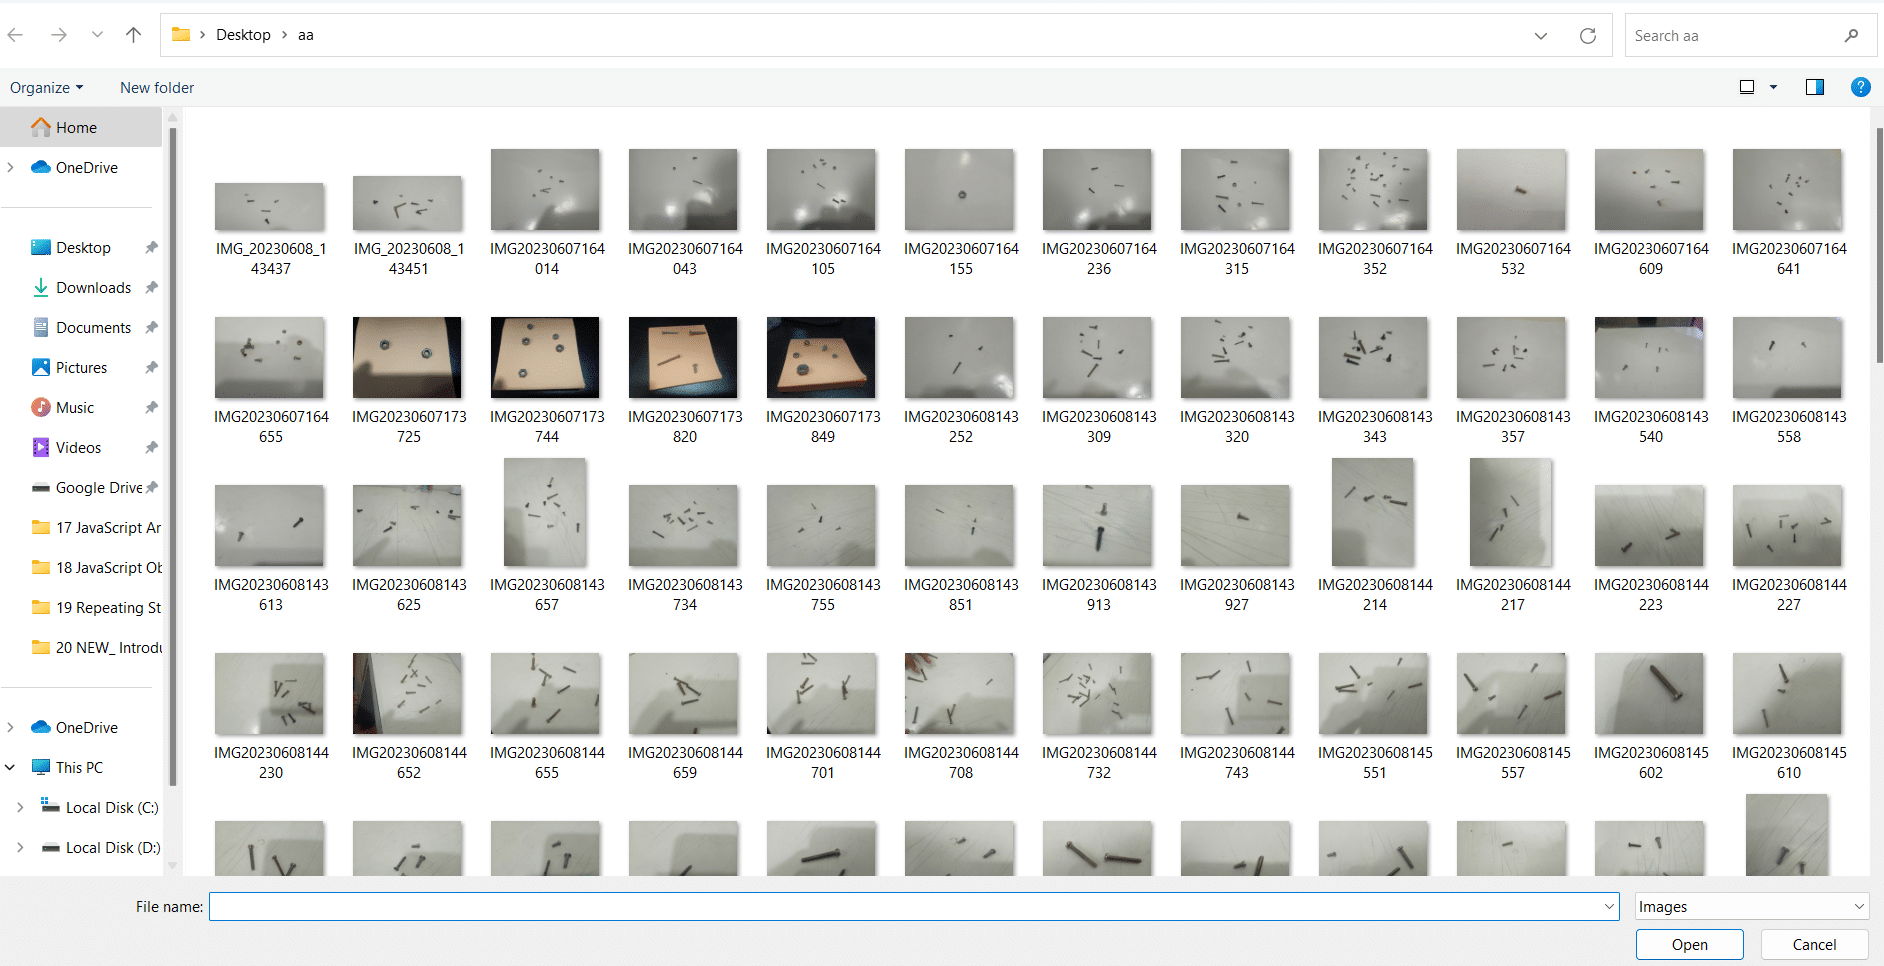
- Select all images which you want to upload then click on “open” option.
- Now page of PictoBlox looks like this:
Making Bounding Box – Labelling Images
A bounding box is an imaginary rectangle that serves as a point of reference for object detection and creates a collision box for that object.
We draw these rectangles over images, outlining the object of interest within each image by defining its X and Y coordinates. This makes it easier for machine learning algorithms to find what they’re looking for, determine collision paths and conserves valuable computing resources.
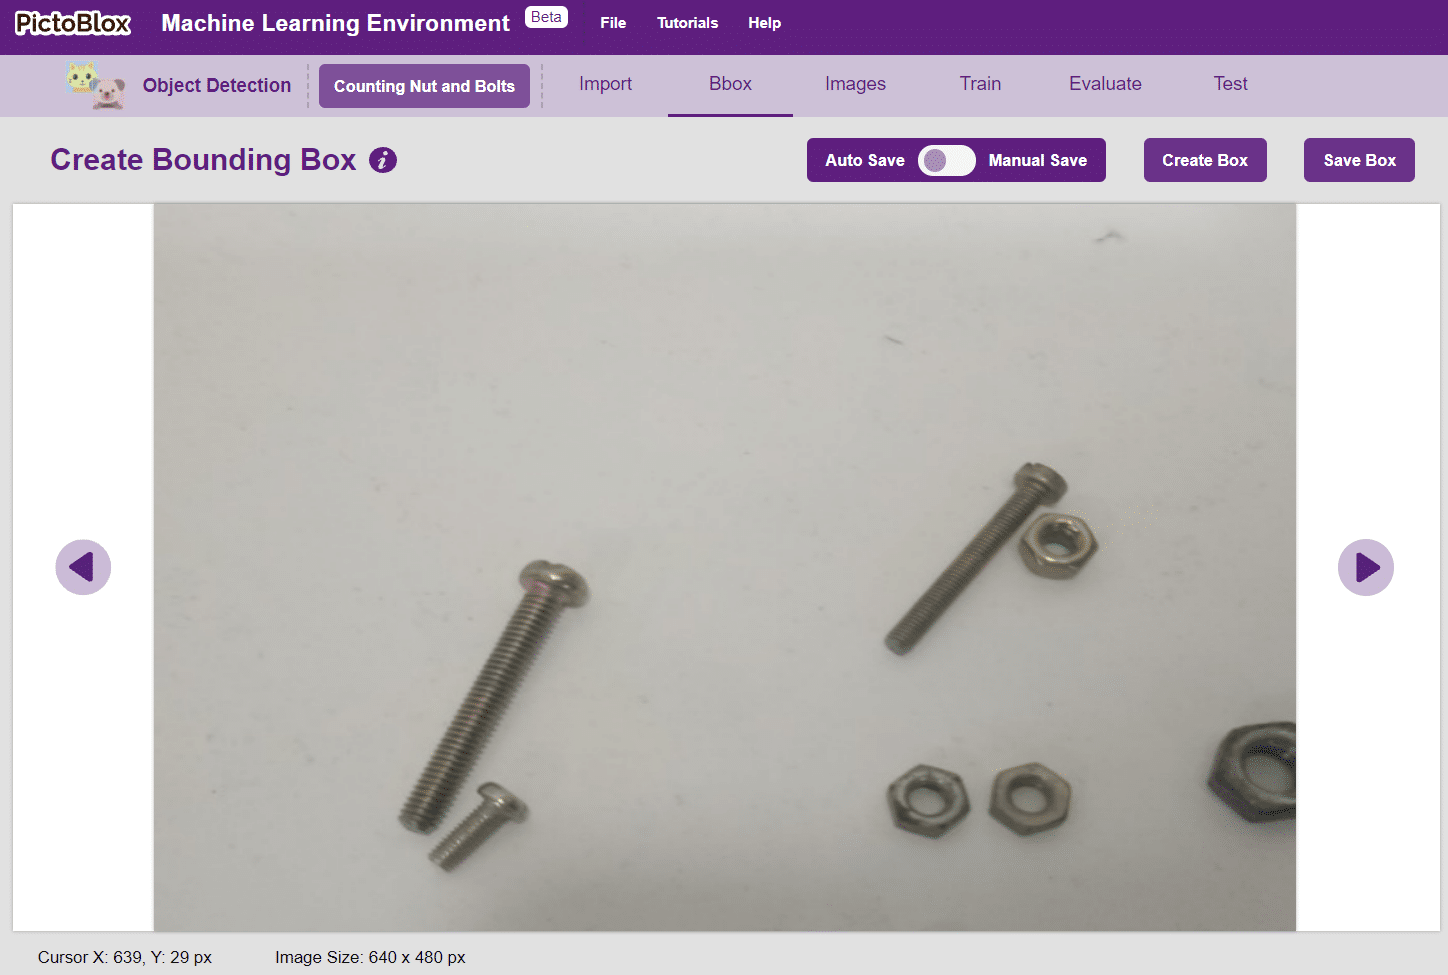
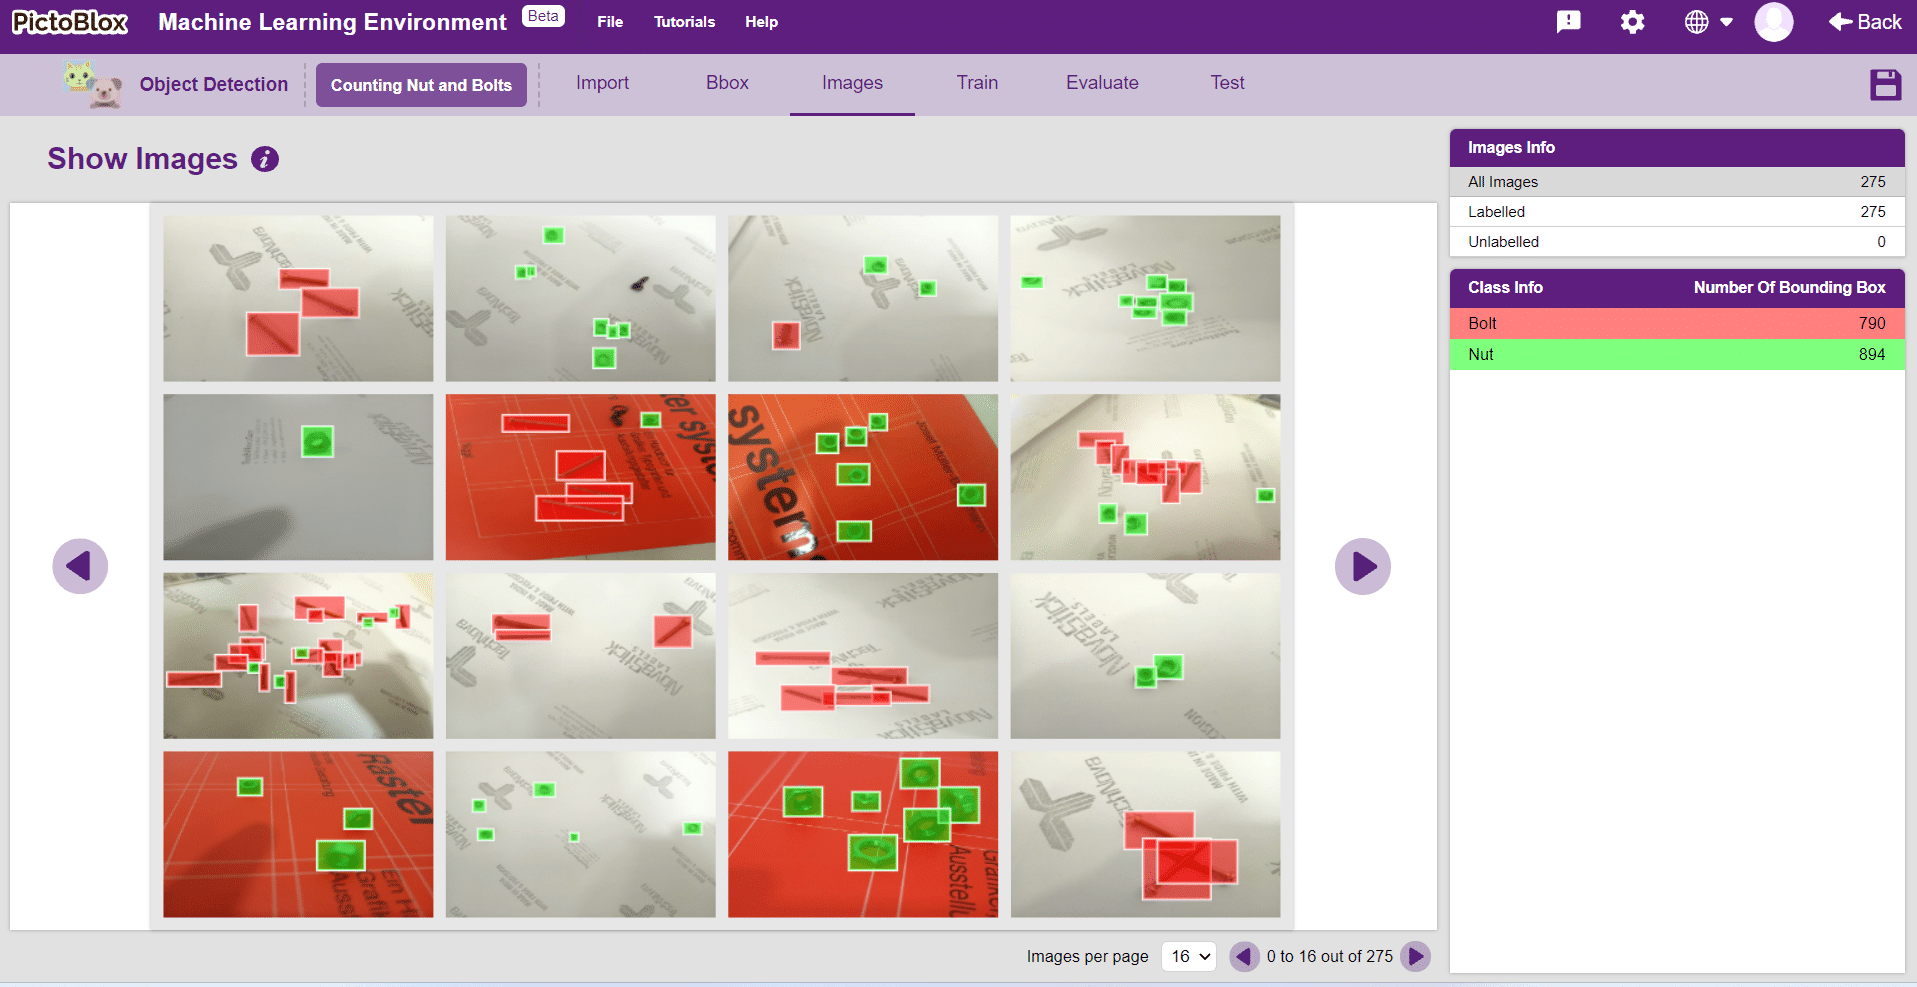
- Labeling is essential for Object Detection. Click on the “Bbox” tab to make the labels.

Notes:
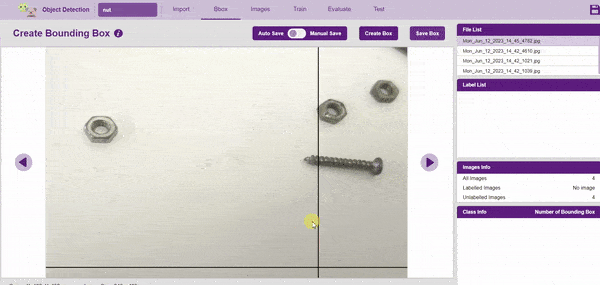
- Notice how the targets are marked with a bounding box. The labels appear in the “Label List” column on the right.
- A single image can have multiple targets. Every target must be enclosed in a bounding box.
- The bounding boxes are color coded.
- To create the bounding box in the images, click on the “Create Box” button, to create a bounding box. After the box is drawn, go to the “Label List” column and click on the edit button, and type in a name for the object under the bounding box. This name will become a class. Once you’ve entered the name, click on the tick mark to label the object.
- Options in Bounding Box:
- Auto Save: This option allows you to auto-save the bounding boxes with the labels they are created. You do not need to save the images every time this option is enabled.
- Manual Save: This option disables the auto-saving of the bounding boxes. When this option is enabled you have to save the image before moving on to the next image for labeling.
- Create Box: This option starts the cursor on the images to create the bounding box. When the box is created, you can label it in the Label List.
- Save Box: This option saves all the bounding boxes created under the Label List.
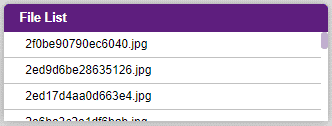
- File List: It shows the list of images available for labeling in the project.
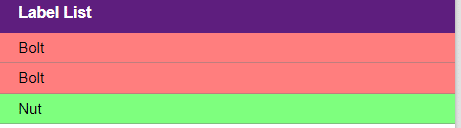
- Label List: It shows the list of Labels created for the selected image.
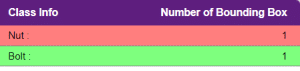
- Class Info: It shows the summary of the classes with the total number of bounding boxes created for each class.
- You can view all the images under the “Image” tab.
Training the Model
In Object Detection, the model must locate and identify all the targets in the given image. This makes Object Detection a complex task to execute. Hence, the hyperparameters work differently in the Object Detection Extension.
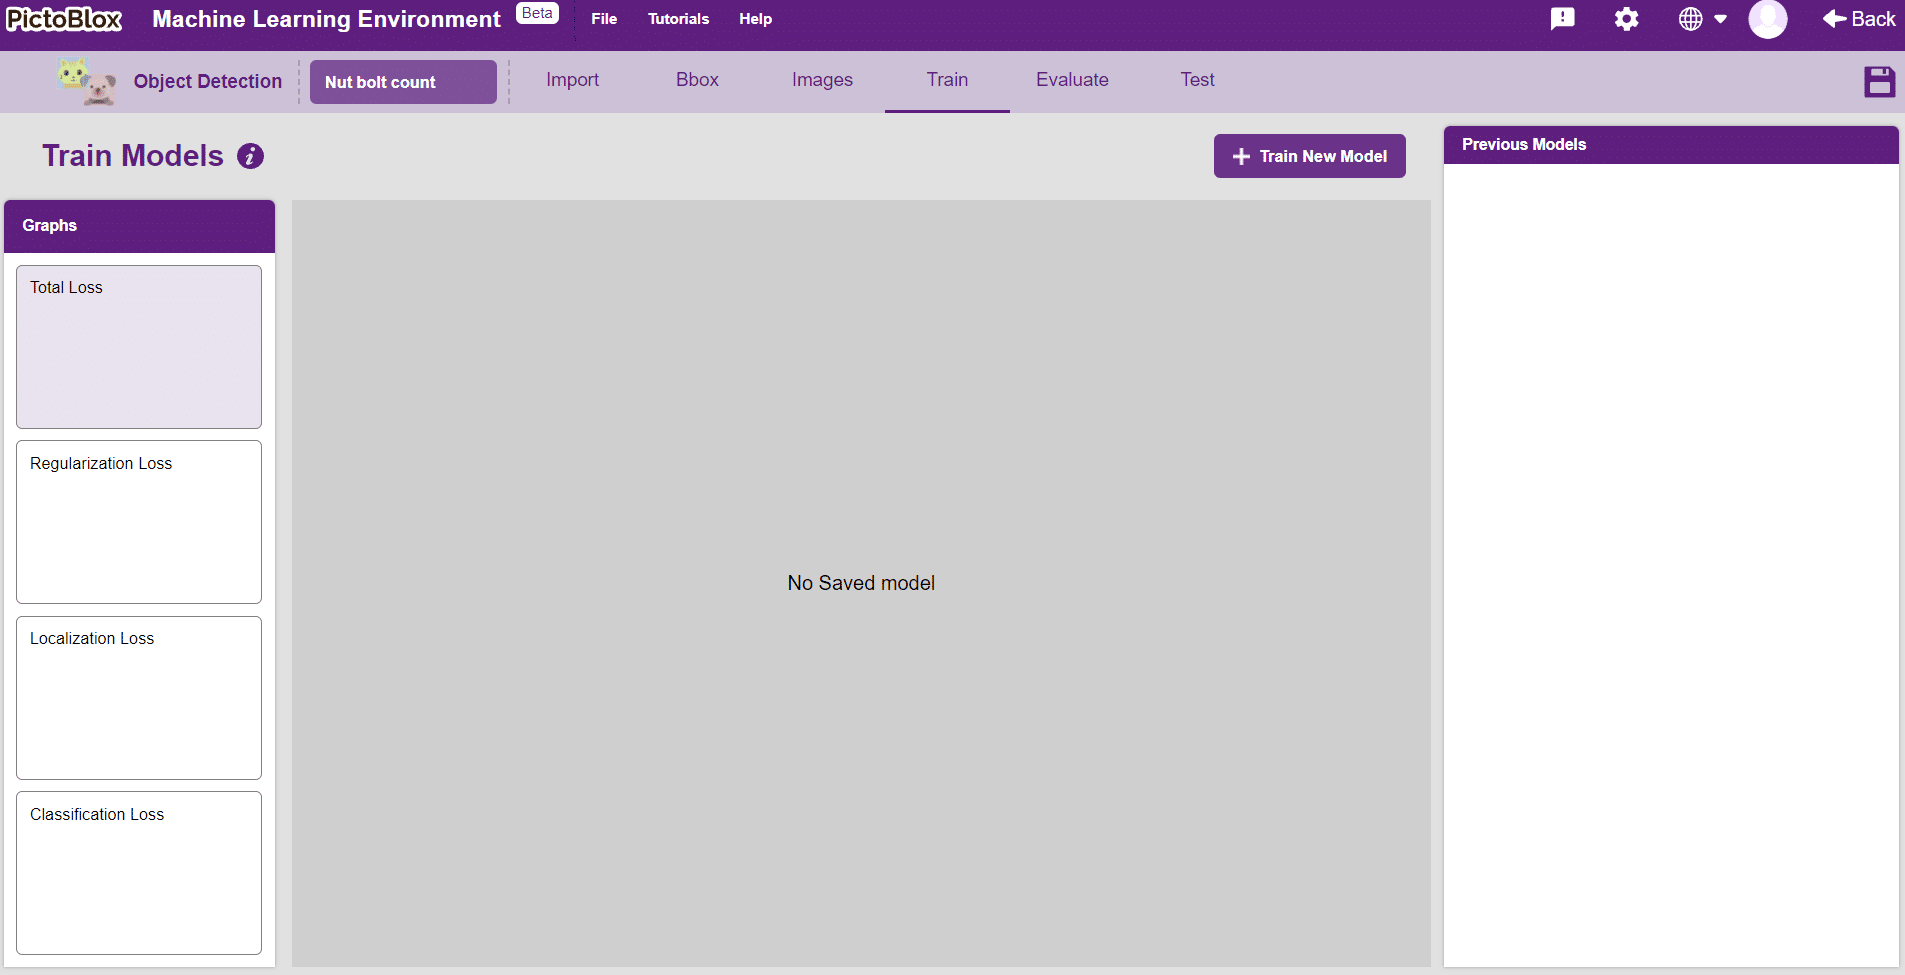
- Go to the “Train” tab. You should see the following screen:
- Click on the “Train New Model” button.
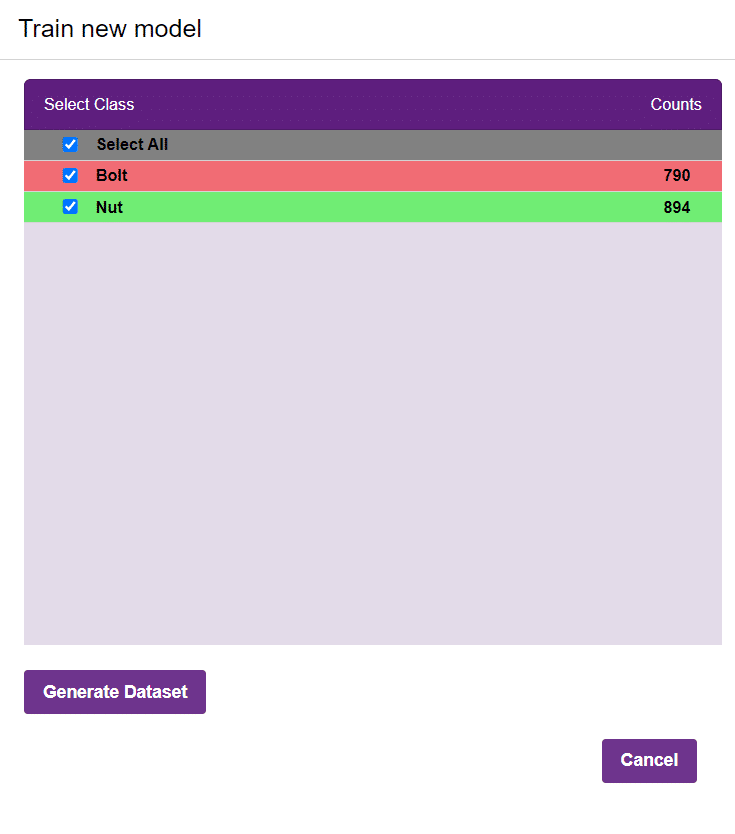
- Select all the classes, and click on “Generate Dataset”.
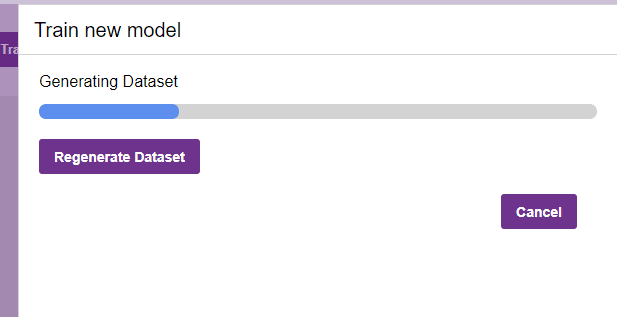
- Once the dataset is generated, click “Next”. You shall see the training configurations.
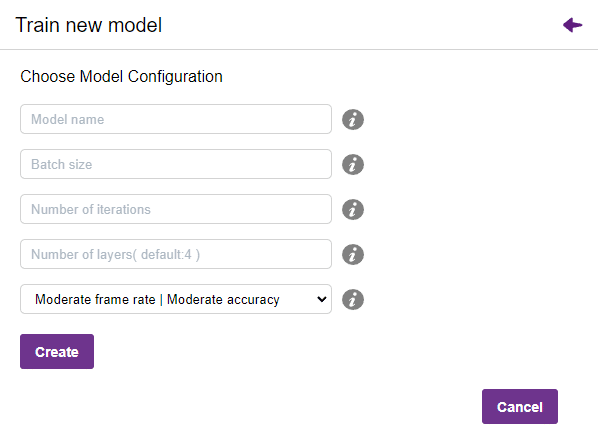
- Observe the hyperparameters.
- Model name- The name of the model.
- Batch size- The number of training samples utilized in one iteration. The larger the batch size, the larger the RAM required.
- The number of iterations- The number of times your model will iterate through a batch of images.
- Number of layers- The number of layers in your model. Use more layers for large models.
- Specify your hyperparameters. If the numbers go out of range, PictoBlox will show a message.
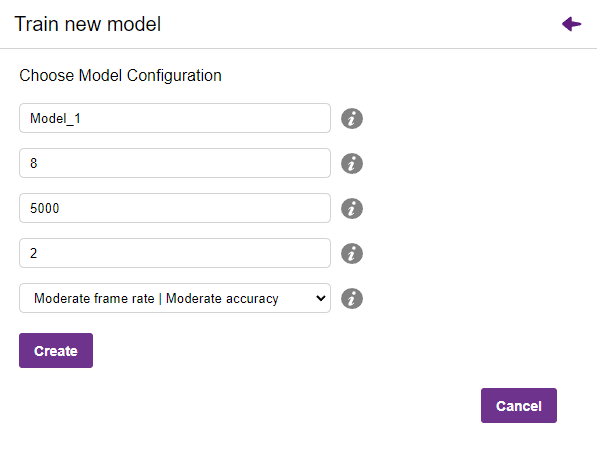
- Click “Create”, It creates a new model according to inserting the value of the hyperparameter.
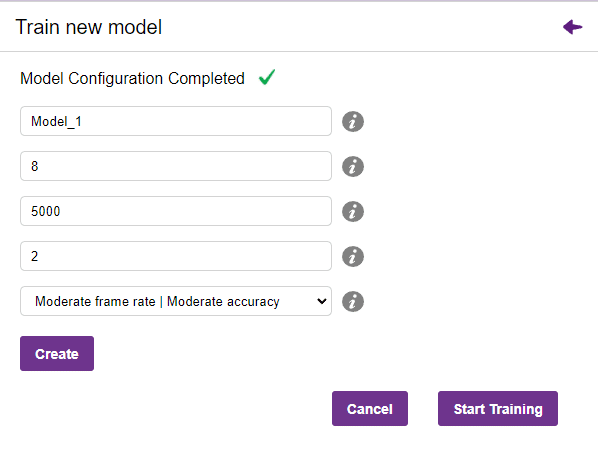
- Click “Start Training”, If desired performance is reached, click on the “Stop”
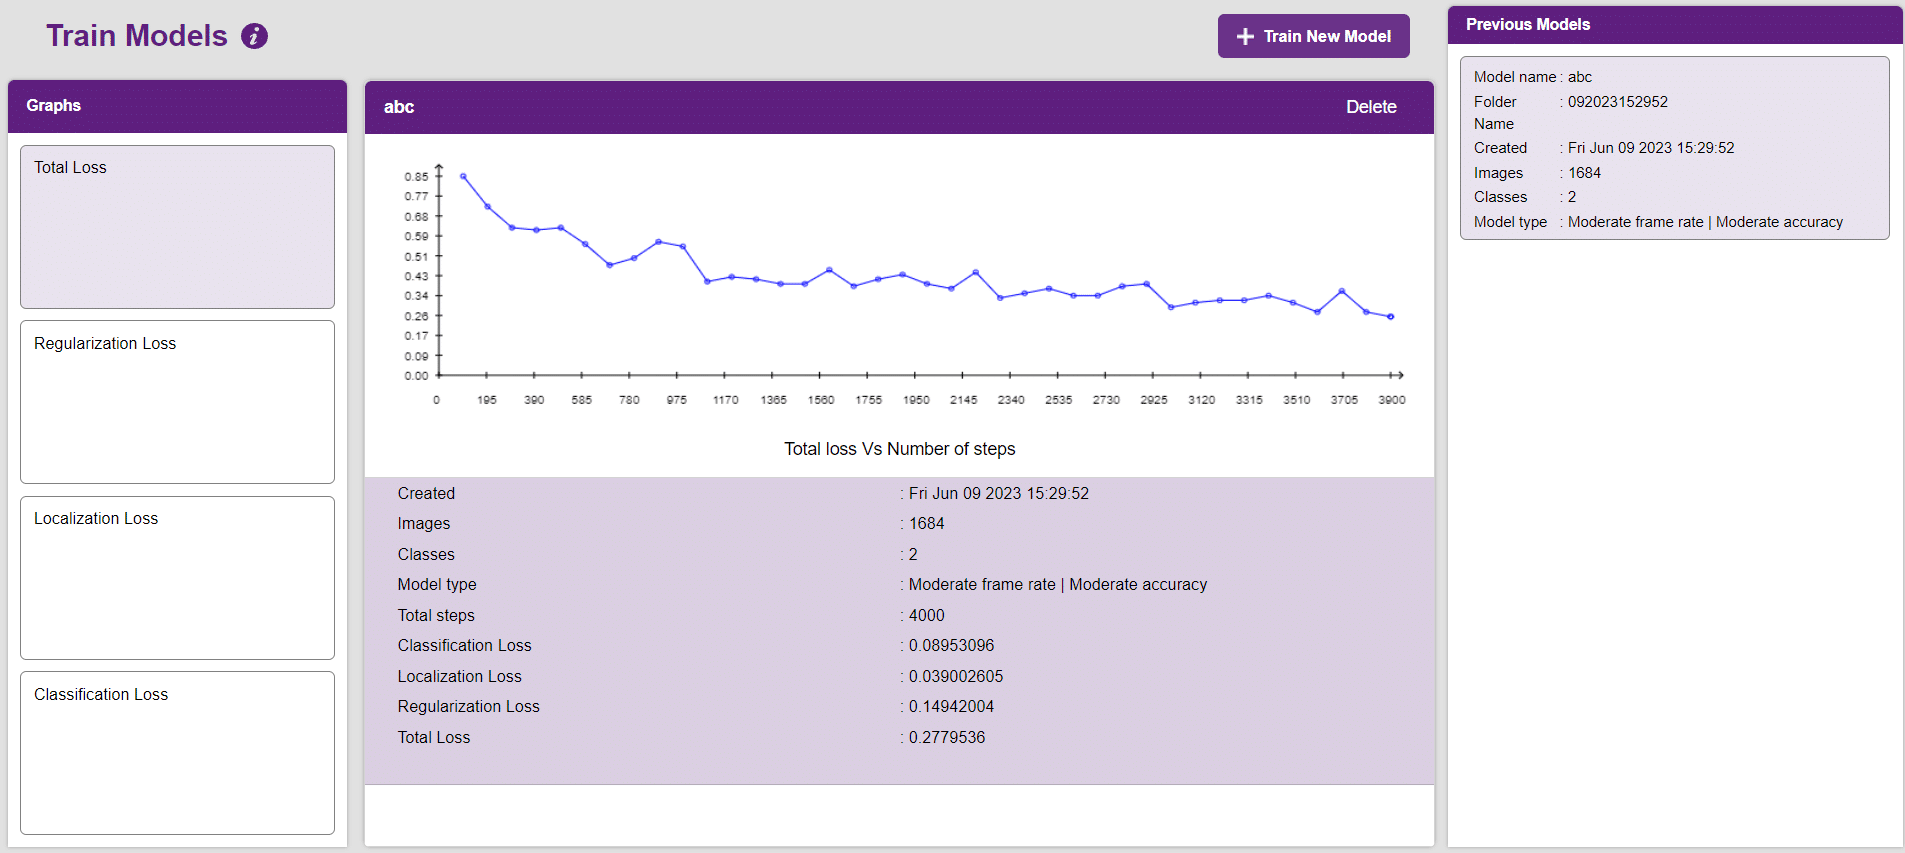
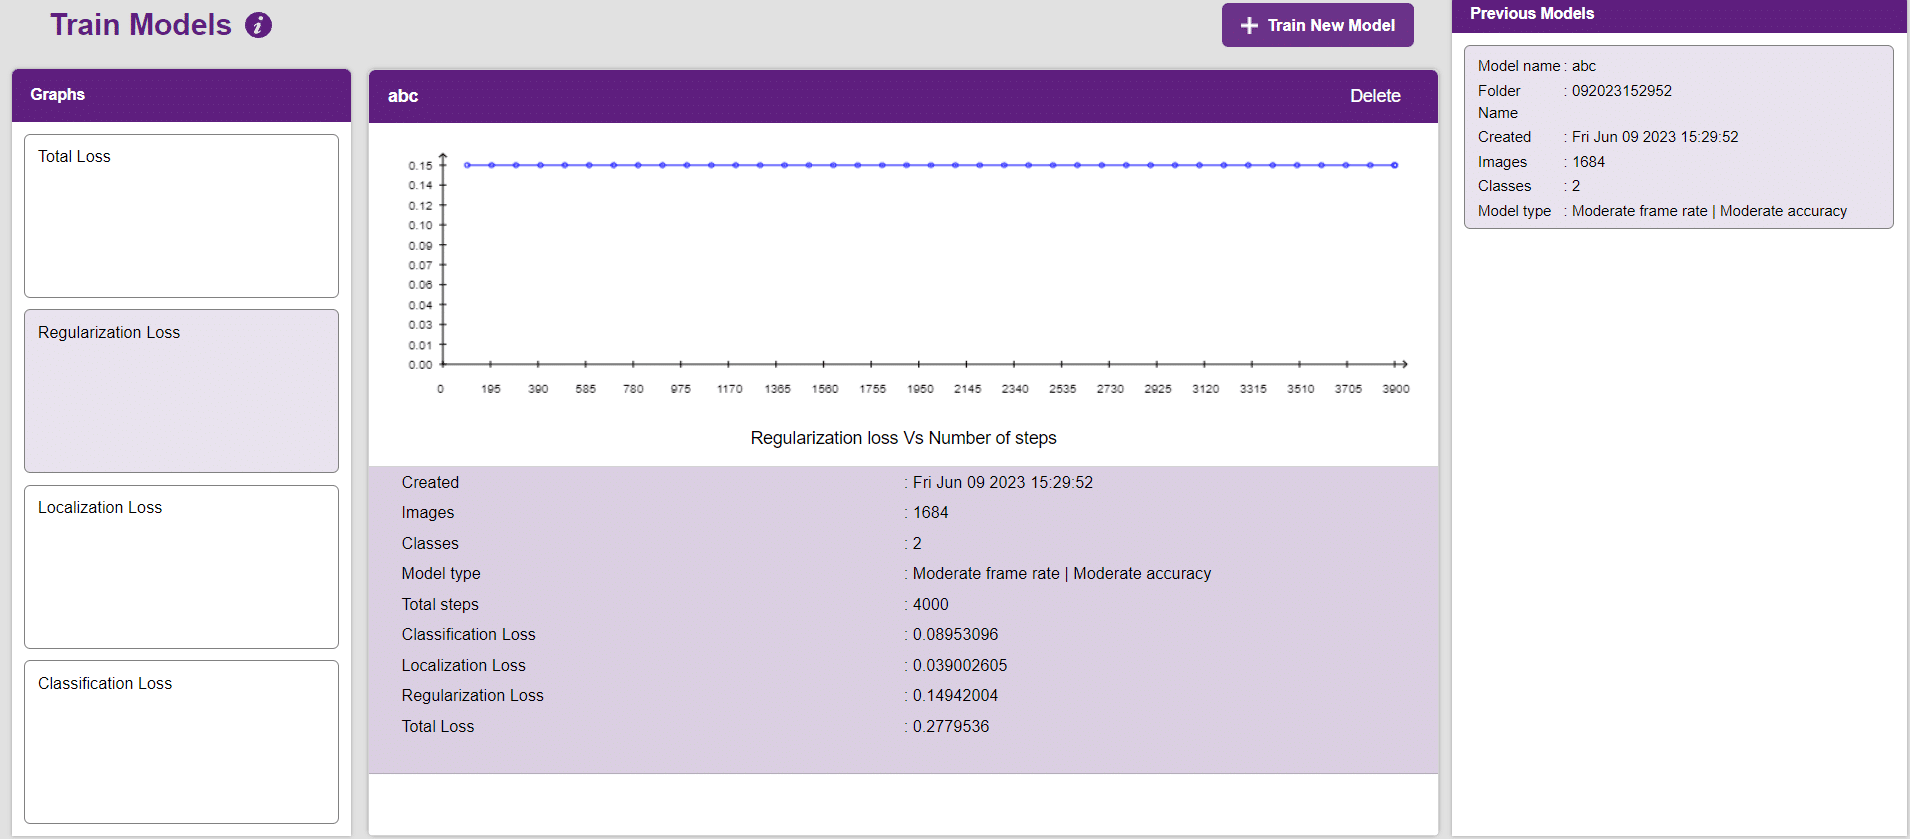
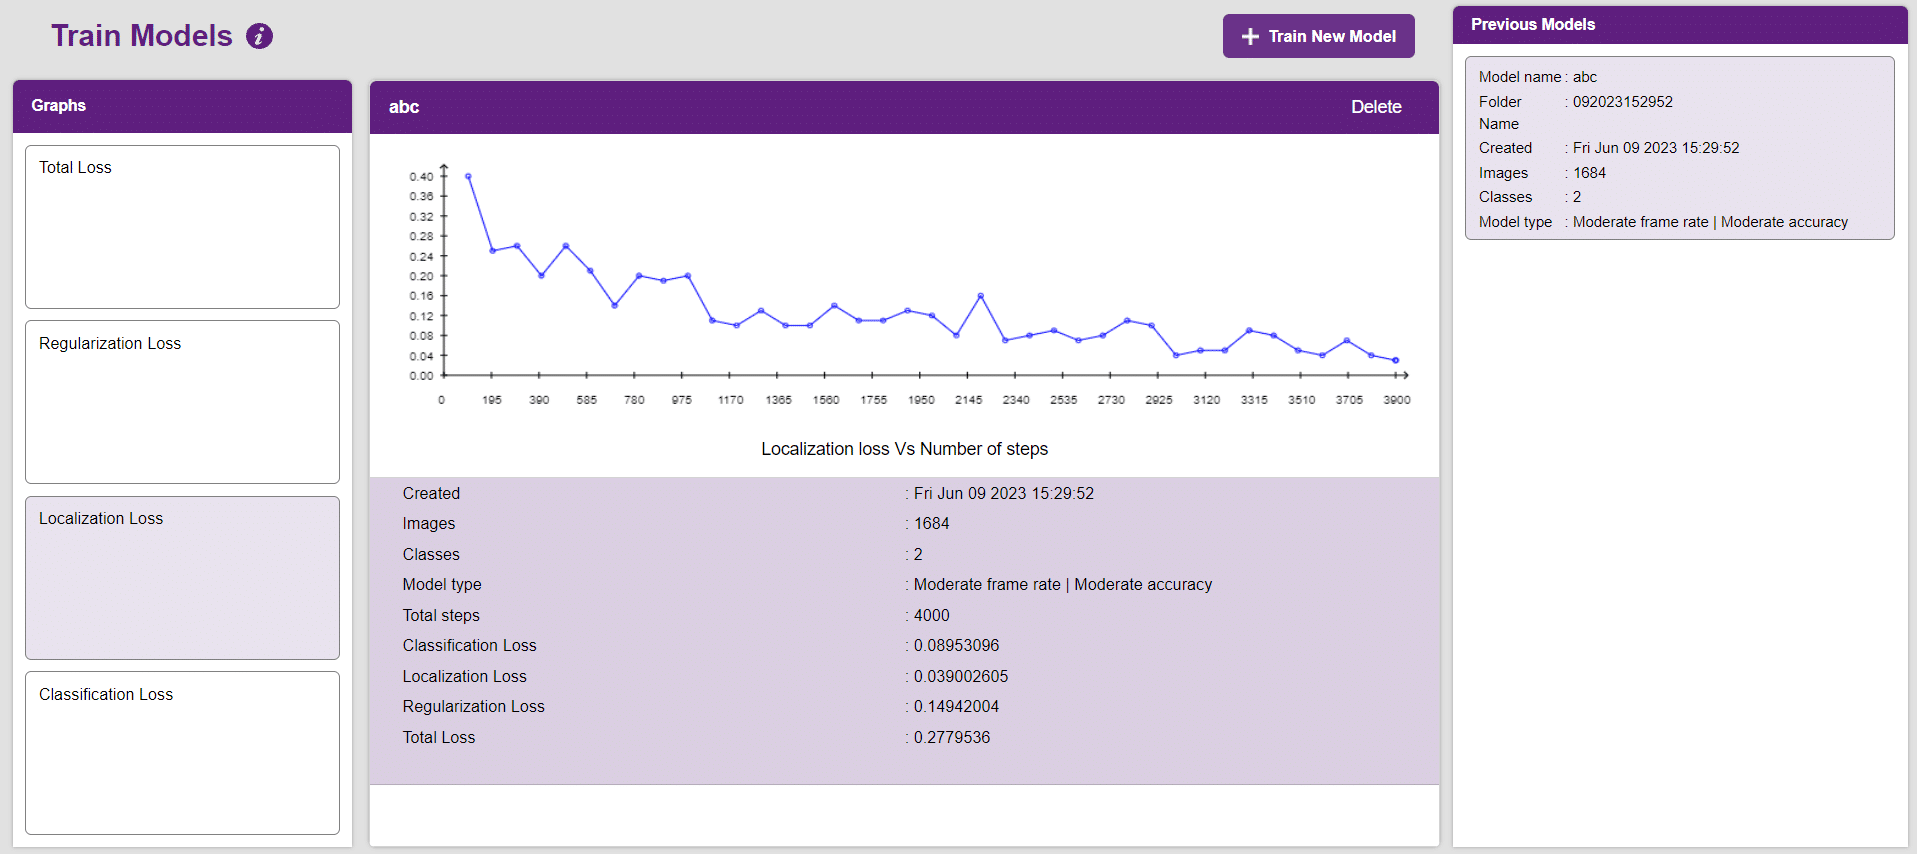
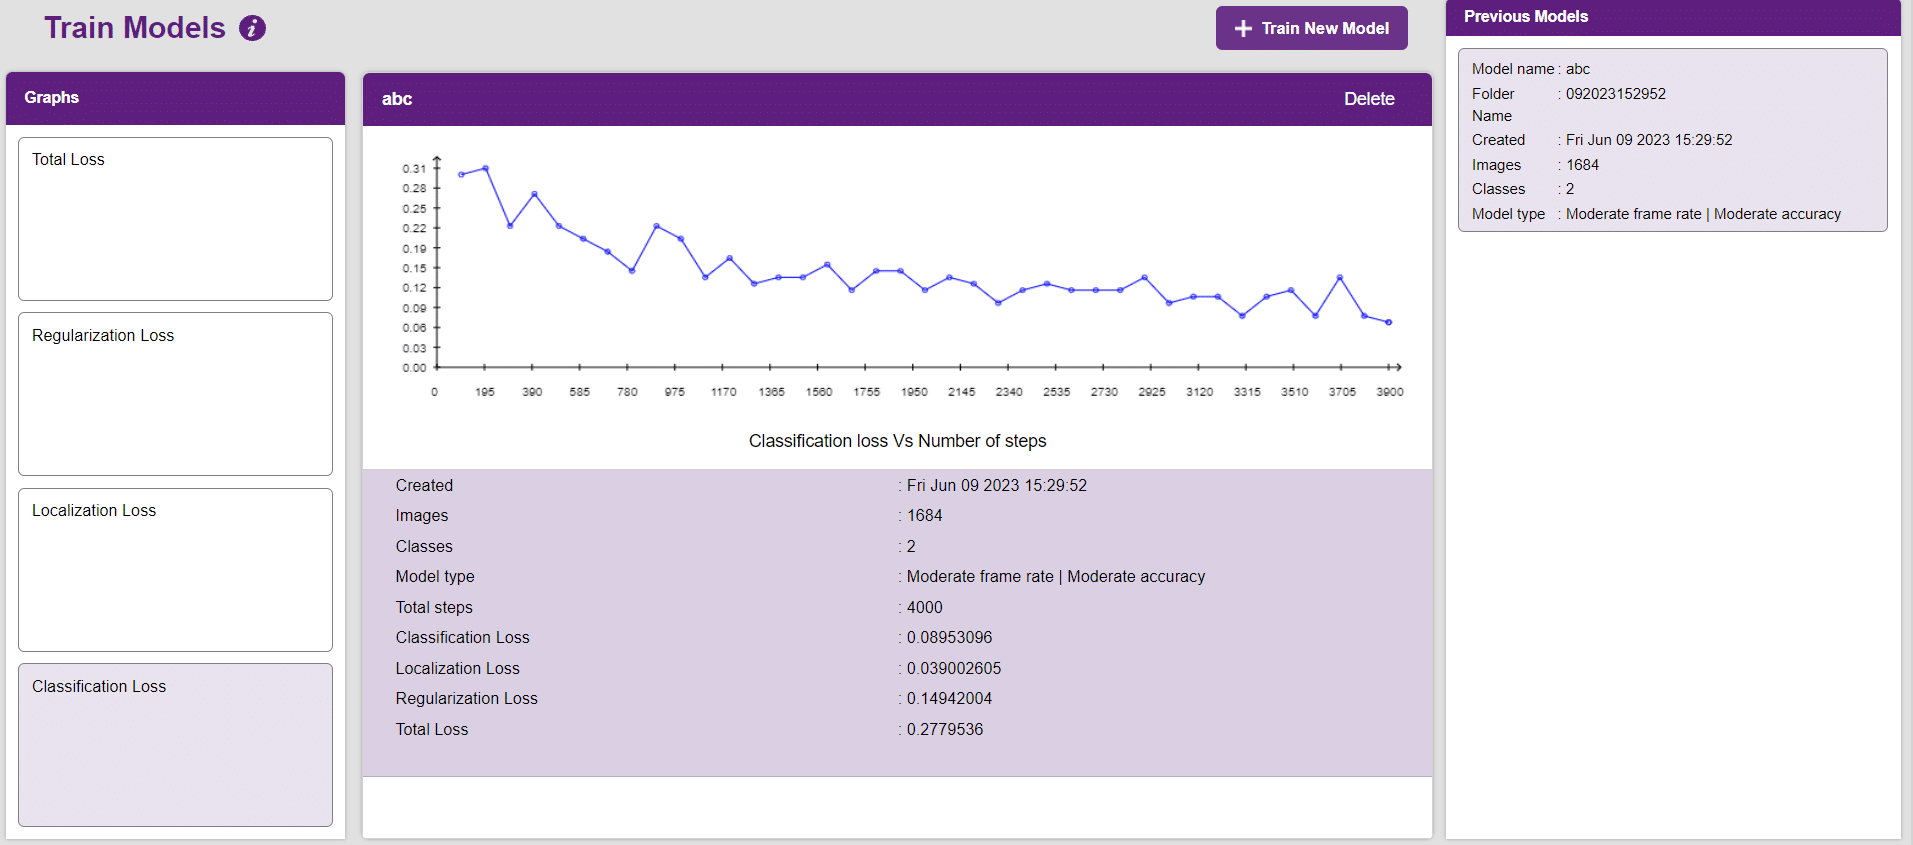
- Total Loss
- Regularization Loss
- Localization Loss
- Classification Loss
- After the training is completed, you’ll see four loss graphs:
Note: Training an Object Detection model is a time taking task. It might take a couple of hours to complete the training.
- You’ll be able to see the graphs under the “Graphs” panel. Click on the buttons to view the graph.
- The graph between “Total loss” and “Number of steps”.
- The graph between “Regularization loss” and “Number of steps”.
- The graph between “Localization” and “Number of steps”.
- The graph between “Classification loss” and “Number of steps”.
- The graph between “Total loss” and “Number of steps”.
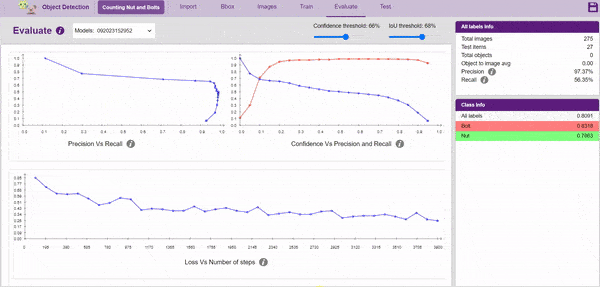
Evaluating the Model
Now, let’s move to the “Evaluate” tab. You can view True Positives, False Negatives, and False Positives for each class here along with metrics like Precision and Recall.
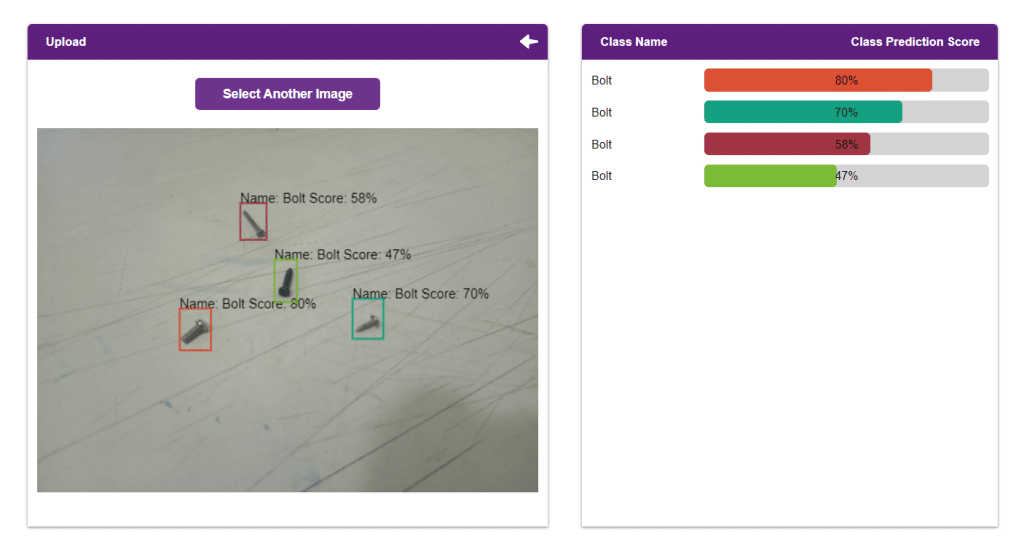
Testing the Model
The model will be tested by uploading an Image from the device:
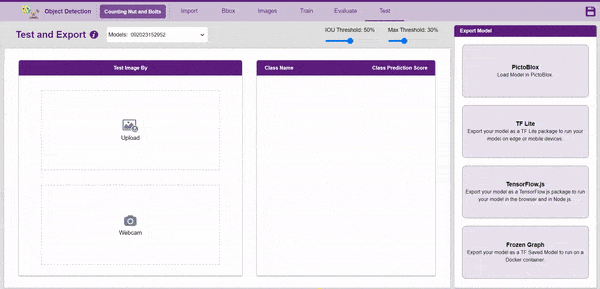
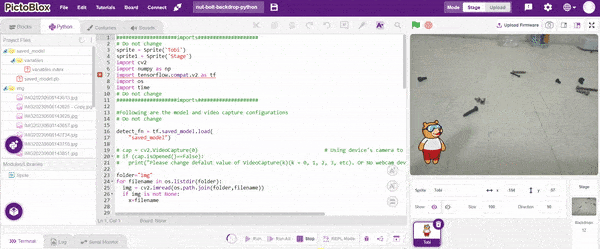
Export in Python Coding
-
- Click on the “PictoBlox” button, and PictoBlox will load your model into the Python Coding Environment if you have opened the ML Environment in the Python Coding.
- Make a new folder(name is img) in Python script and add a number of images for testing.
|
- Also, add the same images in the backdrop and delete the default backdrop.
- Change in Python script according to requirement.
- Click on the “PictoBlox” button, and PictoBlox will load your model into the Python Coding Environment if you have opened the ML Environment in the Python Coding.
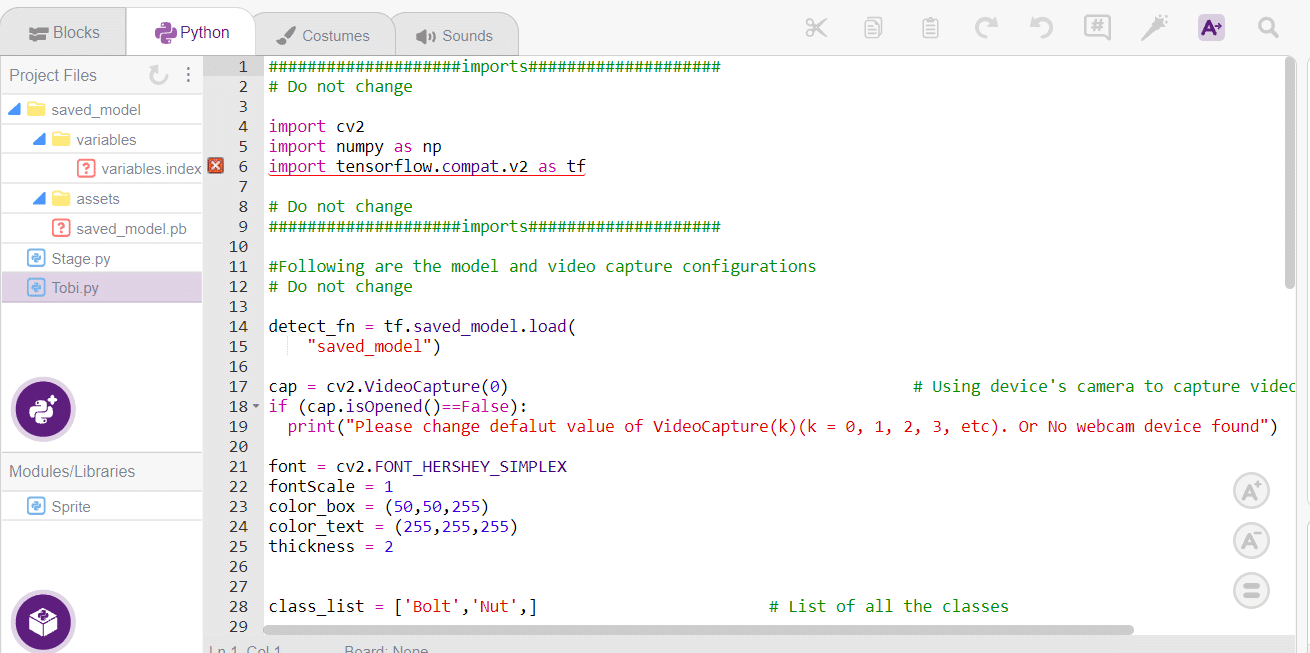
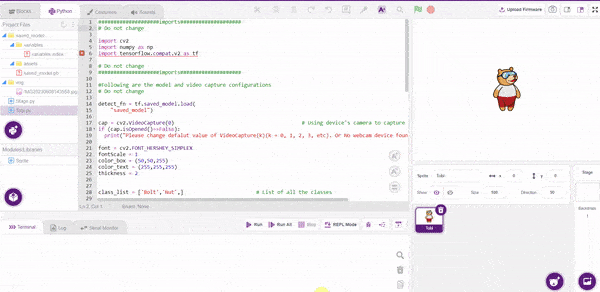
Code
####################imports####################
# Do not change
sprite = Sprite('Tobi')
sprite1 = Sprite('Stage')
import cv2
import numpy as np
import tensorflow.compat.v2 as tf
import os
import time
# Do not change
####################imports####################

#Following are the model and video capture configurations
# Do not change

detect_fn = tf.saved_model.load(
    "saved_model")

# cap = cv2.VideoCapture(0)                                          # Using device's camera to capture video
# if (cap.isOpened()==False):
#   print("Please change defalut value of VideoCapture(k)(k = 0, 1, 2, 3, etc). Or No webcam device found")

folder="img"
for filename in os.listdir(folder):
  img = cv2.imread(os.path.join(folder,filename))
  if img is not None:
    x=filename


    a=0
    b=0
    y=x.split('.')


    font = cv2.FONT_HERSHEY_SIMPLEX
    fontScale = 1
    color_box = (50,50,255)
    color_text = (255,255,255)
    thickness = 2


    class_list = ['Bolt','Nut',]                        # List of all the classes

  #This is the while loop block, computations happen here
    image_np=img
    height, width, channels = image_np.shape                       # Get height, wdith
    image_resized = cv2.resize(image_np,(320,320))                   # Resize image to model input size
    image_resized = cv2.cvtColor(image_resized, cv2.COLOR_BGR2RGB) # Convert bgr image array to rgb image array
    input_tensor = tf.convert_to_tensor(image_resized)             # Convert image to tensor
    input_tensor = input_tensor[tf.newaxis, ...]                   # Expanding the tensor dimensions

    detections = detect_fn(input_tensor)                           #Pass image to model

    num_detections = int(detections.pop('num_detections'))         #Postprocessing
    detections = {key: value[0, :num_detections].numpy() for key, value in detections.items()}
    detections['num_detections'] = num_detections
    detections['detection_classes'] = detections['detection_classes'].astype(np.int64)
    width=320
    height=320
    # Draw recangle around detection object
    for j in range(len(detections['detection_boxes'])):
      # Set minimum threshold to 0.3
      if(detections['detection_scores'][j] > 0.3):
        # Starting and end point of detected object
        starting_point = (int(detections['detection_boxes'][j][1]*width),int(detections['detection_boxes'][j][0]*height))
        end_point = (int(detections['detection_boxes'][j][3]*width),int(detections['detection_boxes'][j][2]*height))
        # Class name of detected object
        className = class_list[detections['detection_classes'][j]-1]
        # Starting point of text
        print(className)
        if(className=="Bolt"):
          a=a+1
        elif(className=="Nut"):
          b=b+1
        starting_point_text = (int(detections['detection_boxes'][j][1]*width),int(detections['detection_boxes'][j][0]*height)-5)
        # Draw rectangle and put text
        image_resized = cv2.rectangle(image_resized, starting_point, end_point,color_box, thickness)
        image_resized = cv2.putText(image_resized,className, starting_point_text, font,fontScale, color_text, thickness, cv2.LINE_AA)
        # Show image in new window
    cv2.imshow("Detection Window",image_resized)
    sprite1.switchbackdrop(y[0])
    print(a)
    print(b)

    if cv2.waitKey(25) & 0xFF == ord('q'):                          # Press 'q' to close the classification window
      break
    time.sleep(2)
    sprite.say("Total number of bolts is "+str(a))
    time.sleep(1)
    sprite.say("Total number of Nuts is "+str(b))
    time.sleep(5)
    sprite.say("")
cv2.waitKey(5)
cv2.destroyAllWindows()                                             # Closes input window
Logic
The example demonstrates how to count nuts and bolts from an image of a stage. Following are the key steps happening:
- Creates a sprite object named “Tobi”. A sprite is typically a graphical sprite that can be animated or displayed on a screen.
- Creates another sprite object named ‘Stage’. It represents the backdrop.
- Imports the ‘time’ module, which provides functions to work with time-related operations using import time.
- Imports the ‘os’ module, which provides functions to work with outside folders and images inside them.
- Make a new folder in the project files and upload testing images from your computer, as well as the same images in the backdrop.
- One by one, go through all uploaded images using the ‘for’ loop.
- Store images in the variable ‘img’ and their labels in the variable ‘filename’.
- Initialize two count variables named ‘a’ and ‘b’ with a 0 value, which stores the count of nuts and bolts in the image.
- Split the label of the image and store only the name of the image in a variable (name y), which is used to change the backdrop.
- Define the new height (which is equal to 320) and width (which is equal to 320) of the detection window so we can easily see bounding boxes on the detected image.
- Write a condition in the code to count the number of nuts and bolts.
- If a nut is detected, it will increase the count of the nut variable (a), and if a bolt is detected, it will increase the count of the bolt variable (b).
- Switch backdrop according to image name using a predefined function (sprite1.switchbackdrop()) for changing backdrop in PictoBlox.
- Show an updated detection window in the output, which contains bounding boxes for detected objects.
- Write a predefined function (sprite.say()) by which ‘Tobi’ will say the number of nuts and bolts.
- Also adds waiting time so we can clearly see the output of the model.
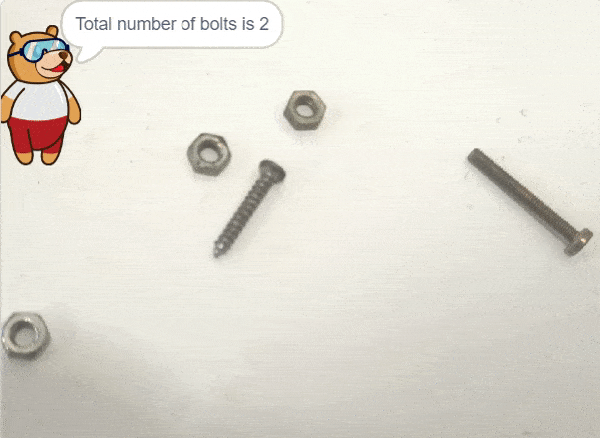
Final Result
Conclusion
Creating a Machine Learning Model to count nuts and bolts can be both complex and time-consuming. Through the steps demonstrated in this project, you can create your own Machine Learning Model that can detect and count nuts and bolts in an image. Once trained, you can export the model into the Python Coding Environment, where you can tweak it further to give you the desired output. Try creating a Machine Learning Model of your own today and explore the possibilities of Object Detection in PictoBlox!