Introduction
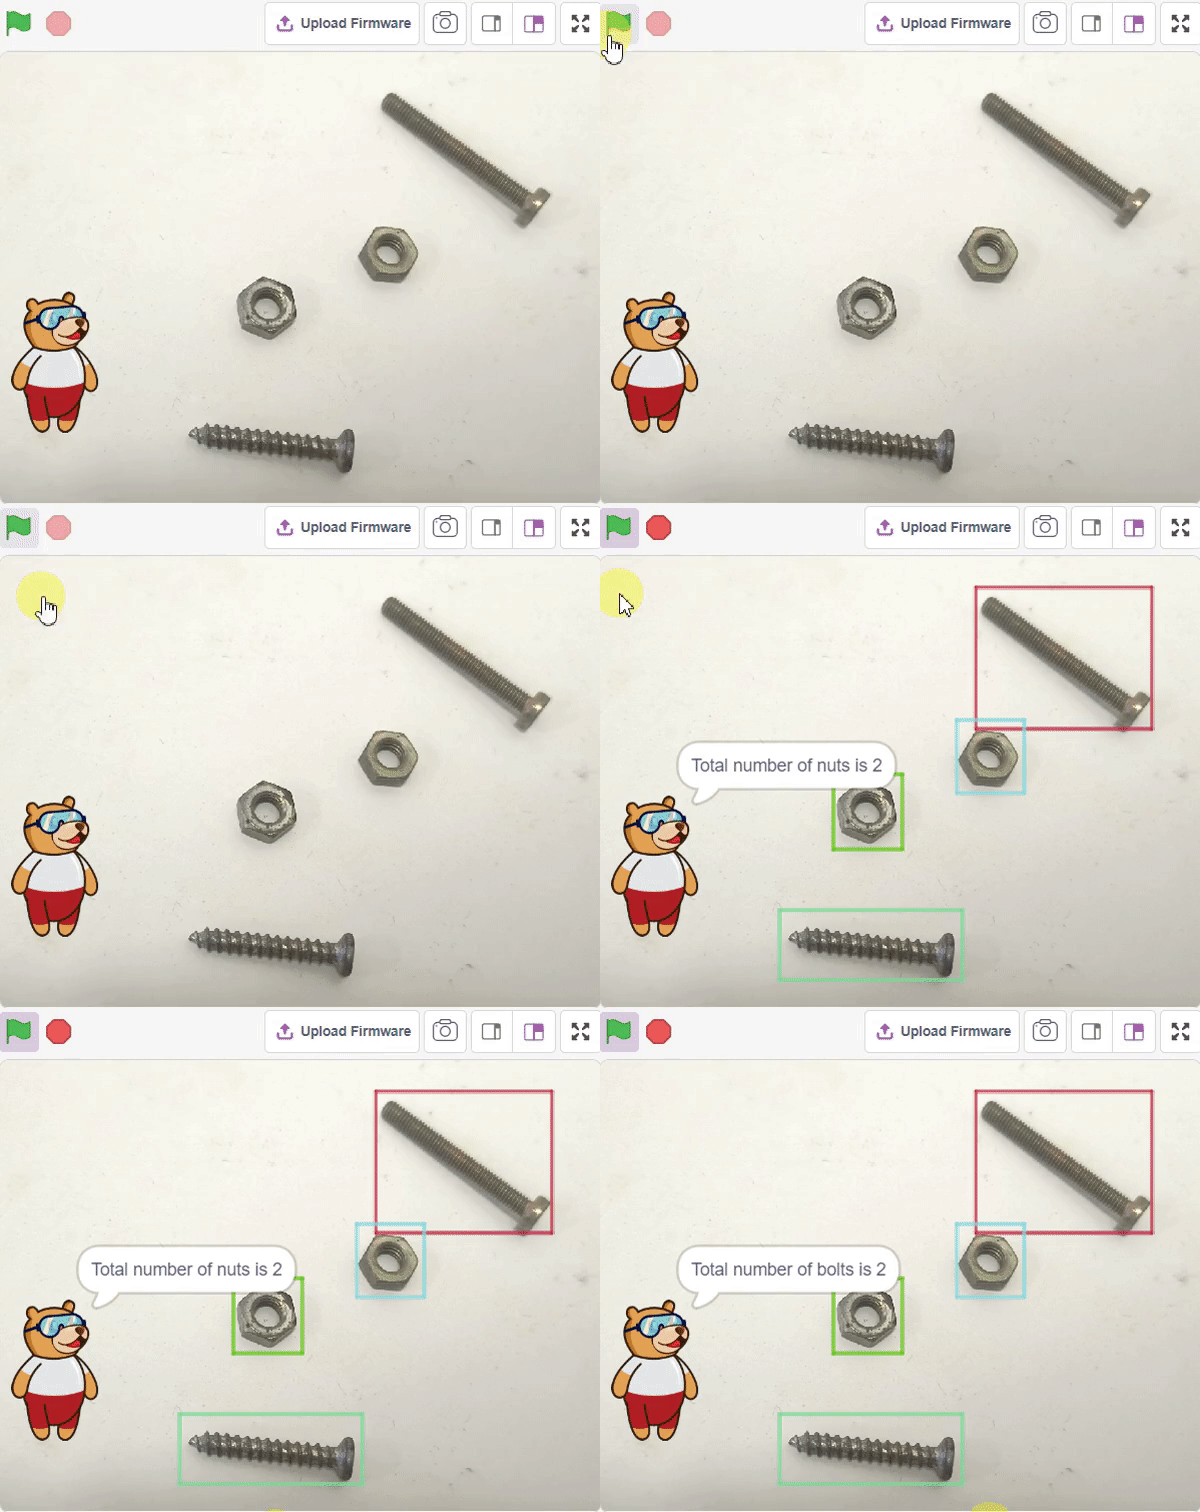
In this example project we are going to create a Machine Learning Model which can count number of nuts and bolts from the camera feed or images.

Object Detection in Machine Learning Environment
Object Detection is an extension of the ML environment that allows users to detect images and making bounding box into different classes. This feature is available only in the desktop version of PictoBlox for Windows, macOS, or Linux. As part of the Object Detection workflow, users can add classes, upload data, train the model, test the model, and export the model to the Block Coding Environment.
Opening Image Detection Workflow

Alert: The Machine Learning Environment for model creation is available in the only desktop version of PictoBlox for Windows, macOS, or Linux. It is not available in Web, Android, and iOS versions.
Follow the steps below:
- Open PictoBlox and create a new file.
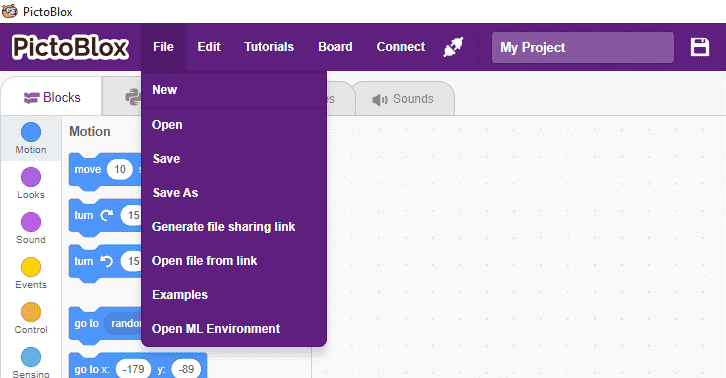
- Select the Block Coding Environment.

- Select the “Open ML Environment” option under the “Files” tab to access the ML Environment.

- You’ll be greeted with the following screen.
Click on “Create New Project”.

- A window will open. Type in a project name of your choice and select the “Object Detection” extension. Click the “Create Project” button to open the Object Detection window.

You shall see the Object Detection workflow. Your environment is all set.
Collecting and Uploading the Data
Uploading images from your device’s hard drive
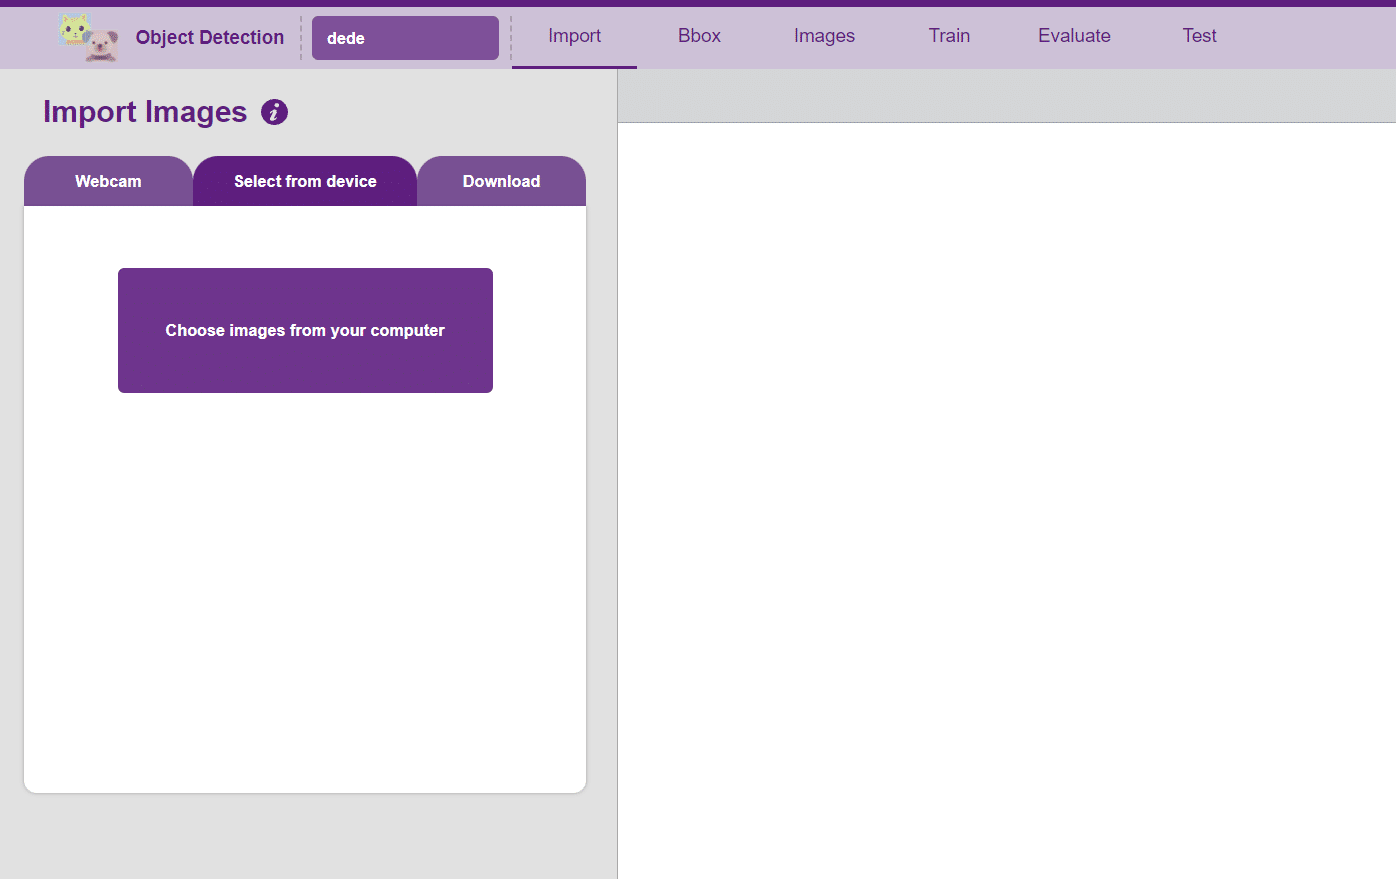
- Now it’s time to upload the images which you downloaded from another source or captured from your camera. Click on the “Select from device” option from the Import Images block.
- Now click on the “Choose images from your computer” and go to the folder where you downloaded your images.

- Select all images which you want to upload then click on “open” option.

- Now page of PictoBlox looks like:

Making Bounding Box – Labelling Images
- Labeling is essential for Object Detection. Click on the “Bbox” tab to make the labels.


Notes: Notice how the targets are marked with a bounding box. The labels appear in the “Label List” column on the right.
- To create the bounding box in the images, click on the “Create Box” button, to create a bounding box. After the box is drawn, go to the “Label List” column and click on the edit button, and type in a name for the object under the bounding box. This name will become a class. Once you’ve entered the name, click on the tick mark to label the object.

- File List: It shows the list of images available for labeling in the project.

- Label List: It shows the list of Labels created for the selected image.

- Class Info: It shows the summary of the classes with the total number of bounding boxes created for each class.

- You can view all the images under the “Image” tab.

Training the Model
In Object Detection, the model must locate and identify all the targets in the given image. This makes Object Detection a complex task to execute. Hence, the hyperparameters work differently in the Object Detection Extension.
- Go to the “Train” tab. You should see the following screen:

- Click on the “Train New Model” button.

- Select all the classes, and click on “Generate Dataset”.

- Once the dataset is generated, click “Next”. You shall see the training configurations.

- Specify your hyperparameters. If the numbers go out of range, PictoBlox will show a message.

- Click “Create”, It creates new model according to inserting value of hyperparameter.

- Click “Start Training”, If desired performance is reached, click on the “Stop”
- Total Loss
- Regularization Loss
- Localization Loss
- Classification Loss
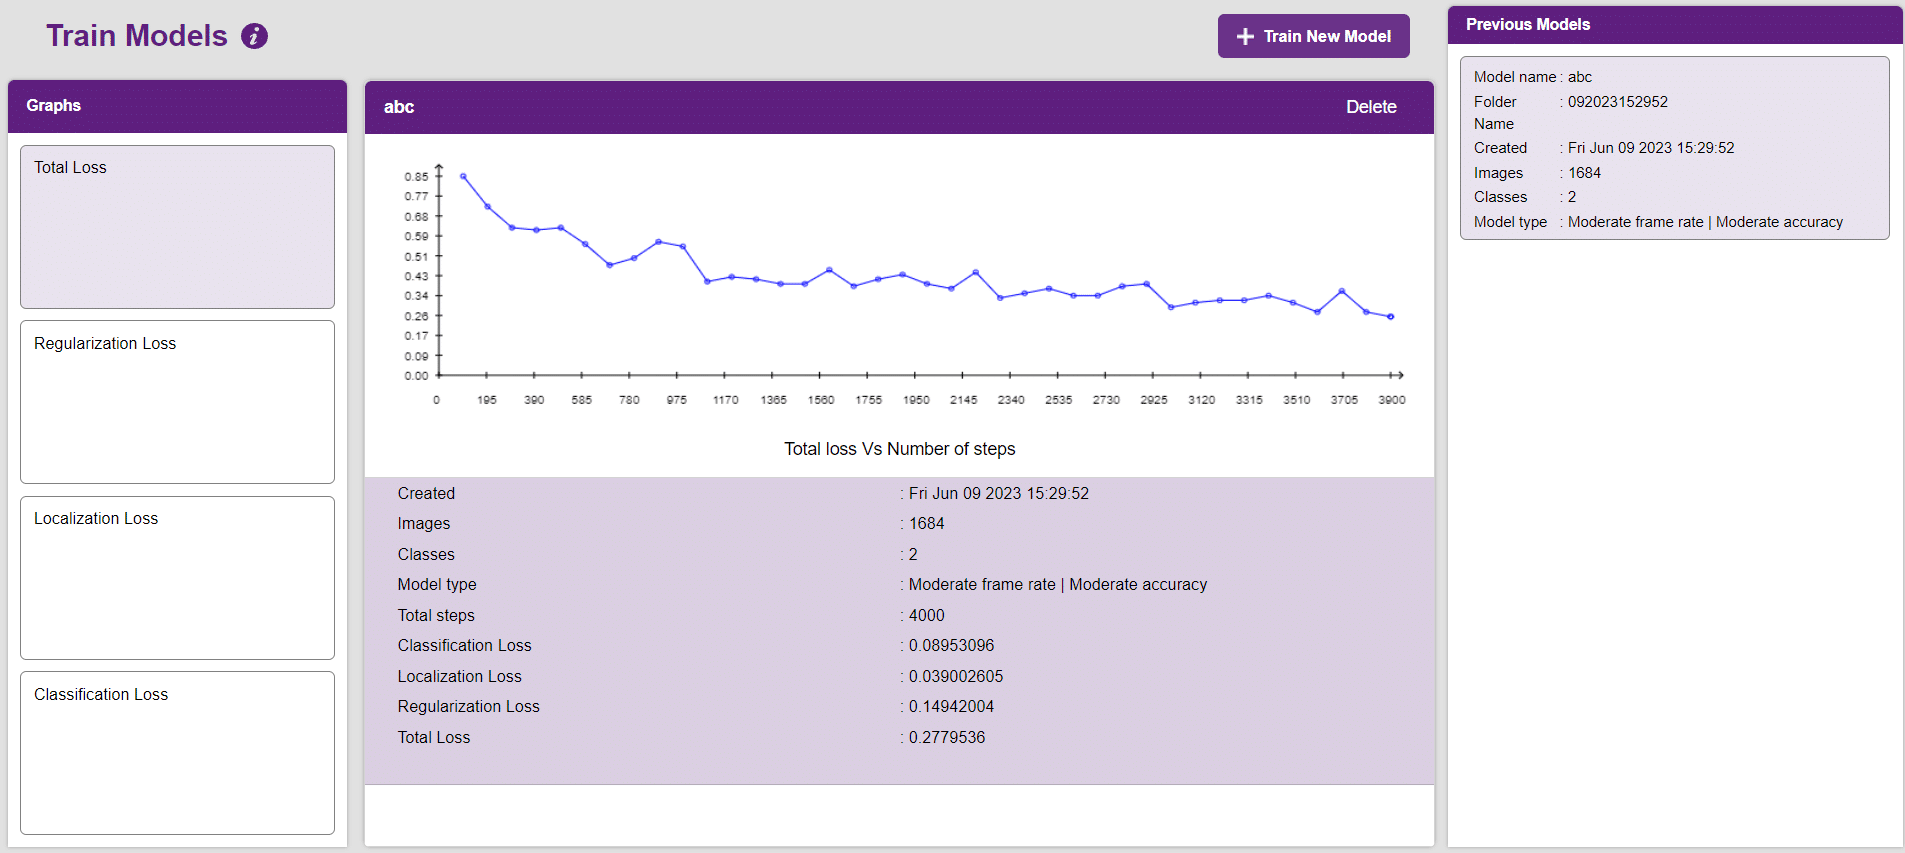
- After the training is completed, you’ll see four loss graphs:
 Note: Training an Object Detection model is a time taking task. It might take a couple of hours to complete training
 - You’ll be able to see the graphs under the “Graphs” panel. Click on the buttons to view the graph.
- Graph between “Total loss” and “Number of steps”.
- Graph between “Regularization loss” and “Number of steps”.

- Graph between “Localization” and “Number of steps”.

- Graph between “Classification loss” and “Number of steps”.

- Graph between “Total loss” and “Number of steps”.
Evaluating the Model
Now, let’s move to the “Evaluate” tab. You can view True Positives, False Negatives, and False Positives for each class here along with metrics like Precision and Recall.

Testing the Model
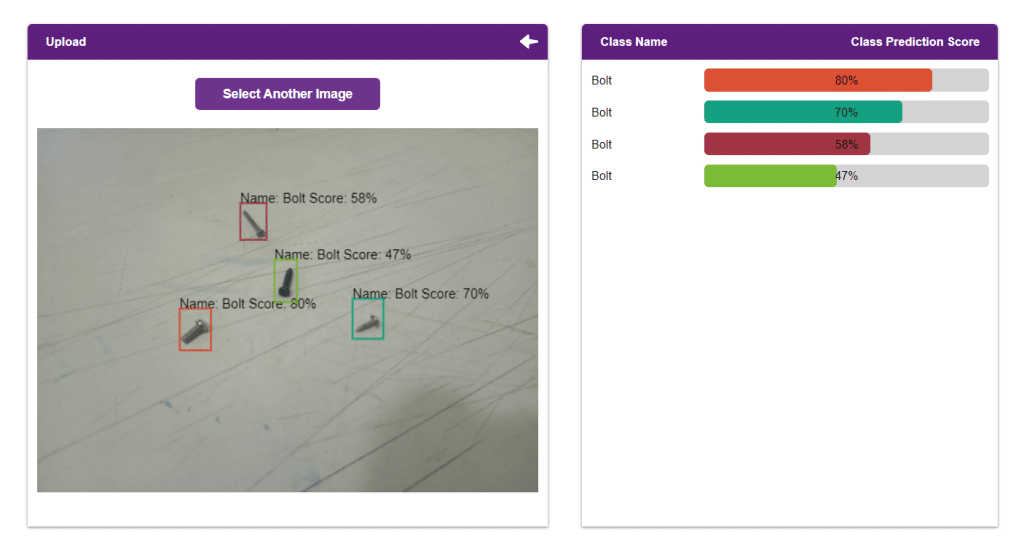
The model will be tested by uploading an Image from device:

Export in Block Coding
Click on the “PictoBlox” button, and PictoBlox will load your model into the Block Coding Environment if you have opened the ML Environment in the Block Coding.

Code
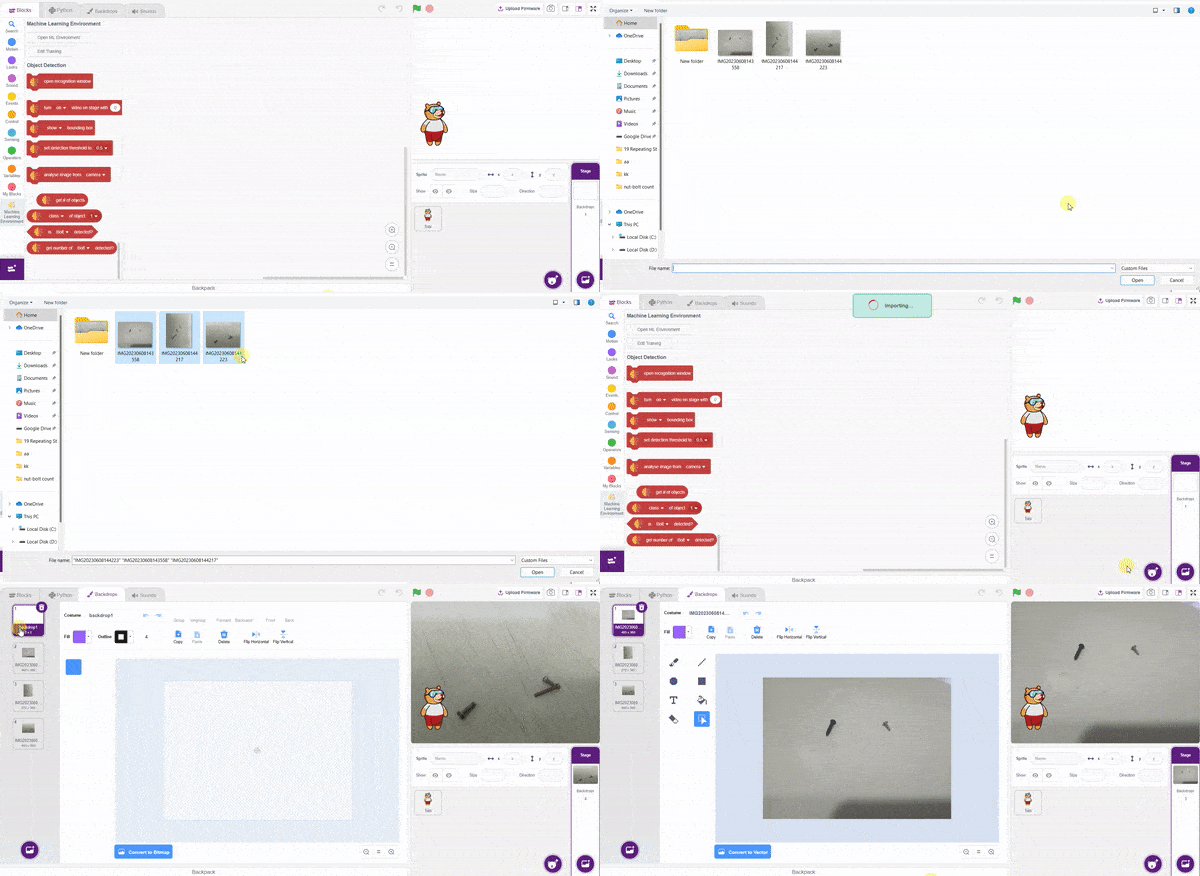
The idea is simple, we’ll add image samples in the “Backdrops” column. We’ll keep cycling through the backdrops and keep predicting the image on the stage.
- Add testing images in the backdrop and delete default backdrop.
- Now, come back to the coding tab and select the Tobi sprite.
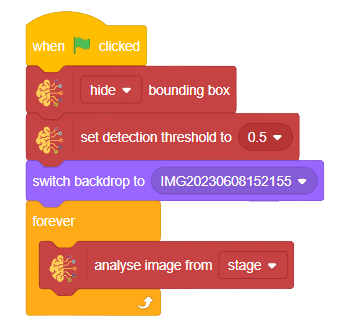
- We’ll start by adding a when flag clicked block from the Events palette.
- Add () bounding box block from the Machine Learning palette. Select the “hide” option.
- Follow it up with a set detection threshold to () block from the Machine Learning palette and set the drop-down to 0.5.
- Add switch backdrop to () block from the Looks palette. Select any image.
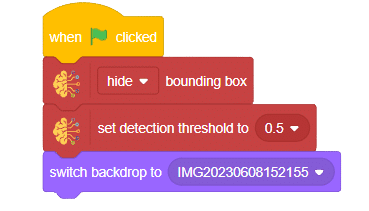
- Add a forever block from the Control palette
- Add analyse image from() block from the Machine Learning palette. Select the “stage” option.
- Add () bounding box block from the Machine Learning palette. Select the “show” option.
- Add two blocks of say () for () seconds from the Looks palette.
- Inside the say block add join () () block from operator palette.
- Inside the join block write statement at first empty place and at second empty place add get number of () detected? from the Machine Learning palette.
- Select the “Nut” option for first get number of () detected and for second choose “Bolt” option.
- Add the () bounding box block from the Looks palette. Select the “hide” option.
- Finally, add the next backdrop block from the Looks palette below the () bounding box block.
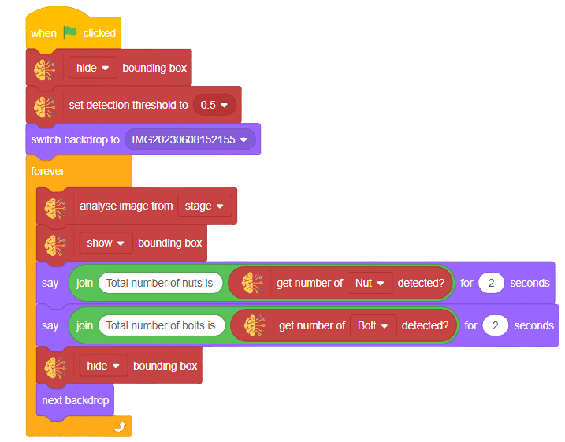
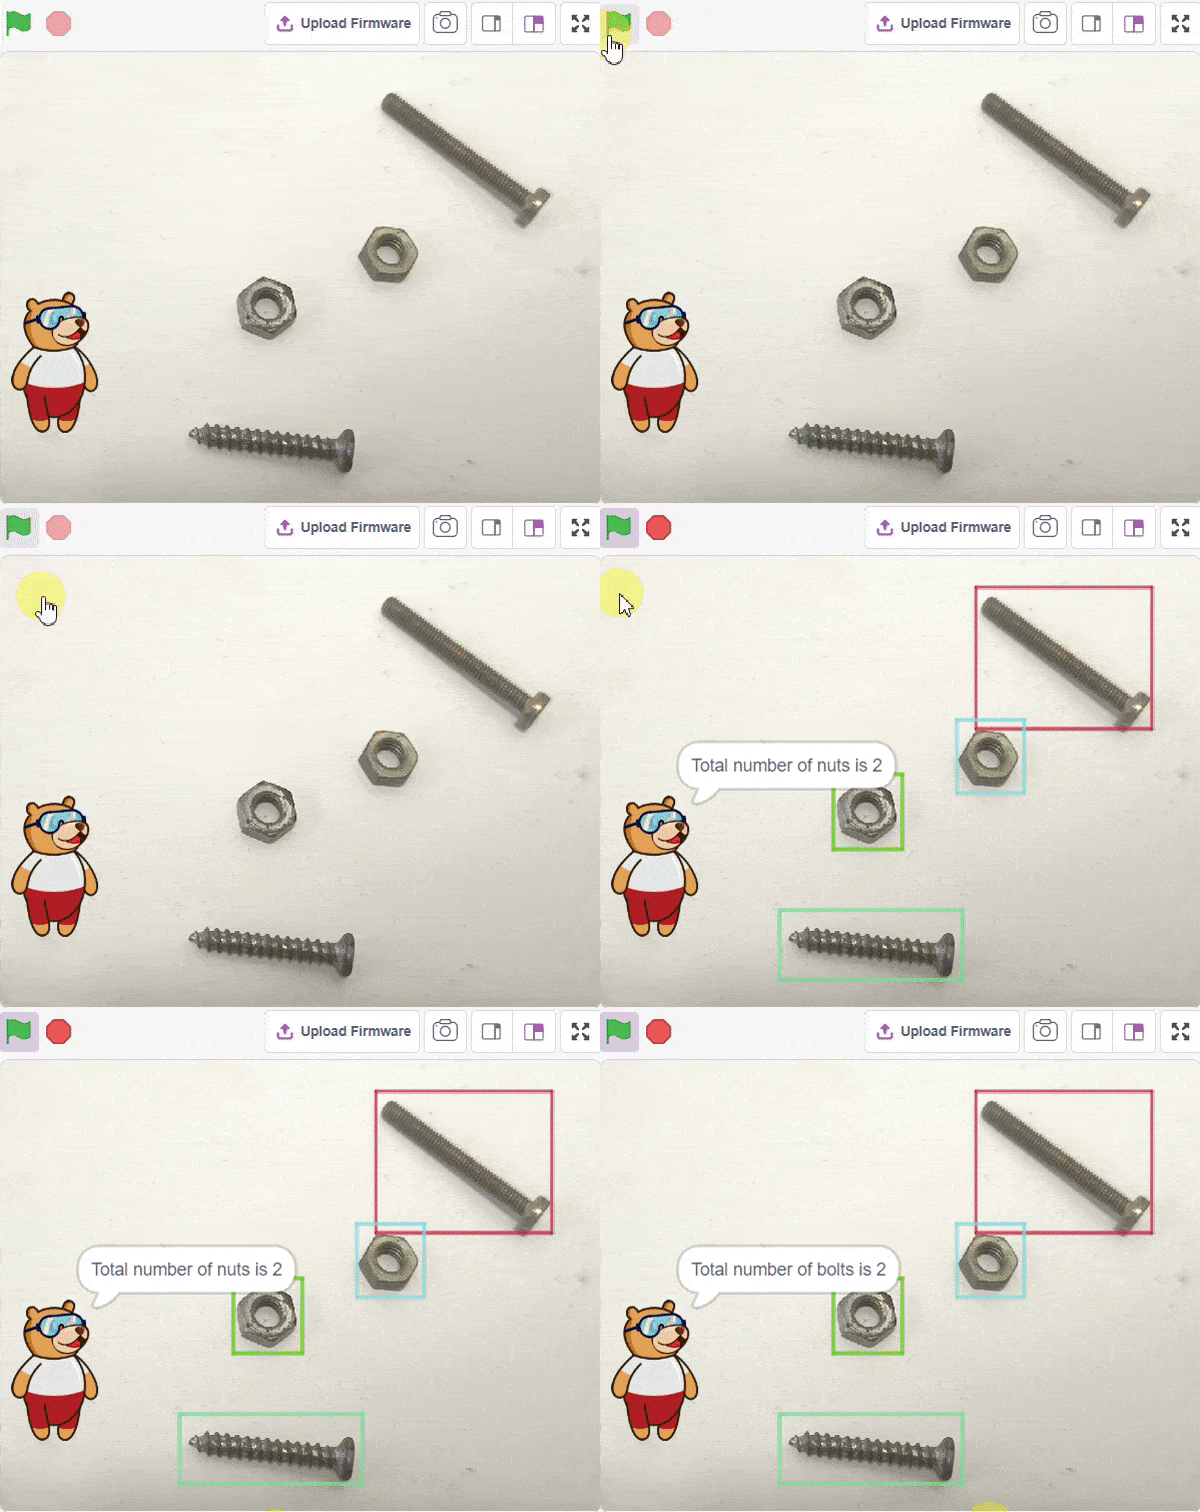
Final Result


