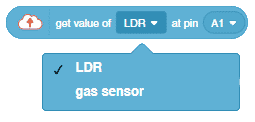
The project demonstrates how to interface the gas sensor to the Quarky and get the PPM reading. Later, we will create an air pollution monitoring system on Adafruit IO.
Adafruit IO Settings
We will be using Adafruit IO for creating a switch on the cloud. Follow the instructions:
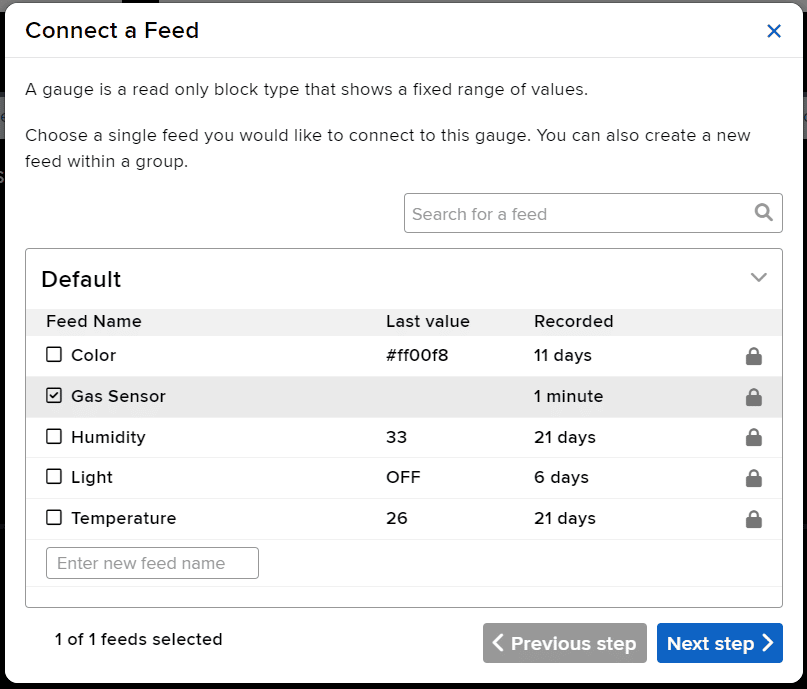
- Create a new Feed named Gas Sensor.
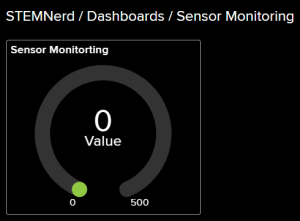
- Create a new Dashboard named Sensor Monitoring.
- Edit the Dashboard and add a Gauge Block.
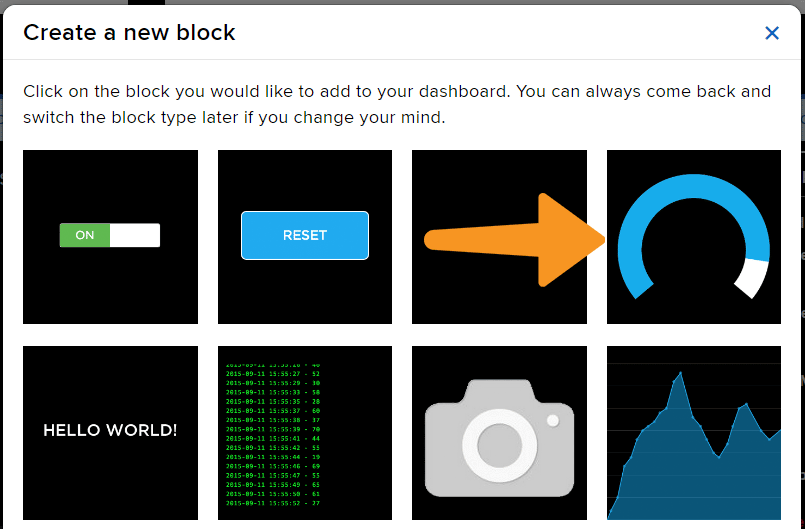
- Connect the Gas Sensor feed to the block and click on Next Step.
- Edit the Block Setting and click on Create Block.
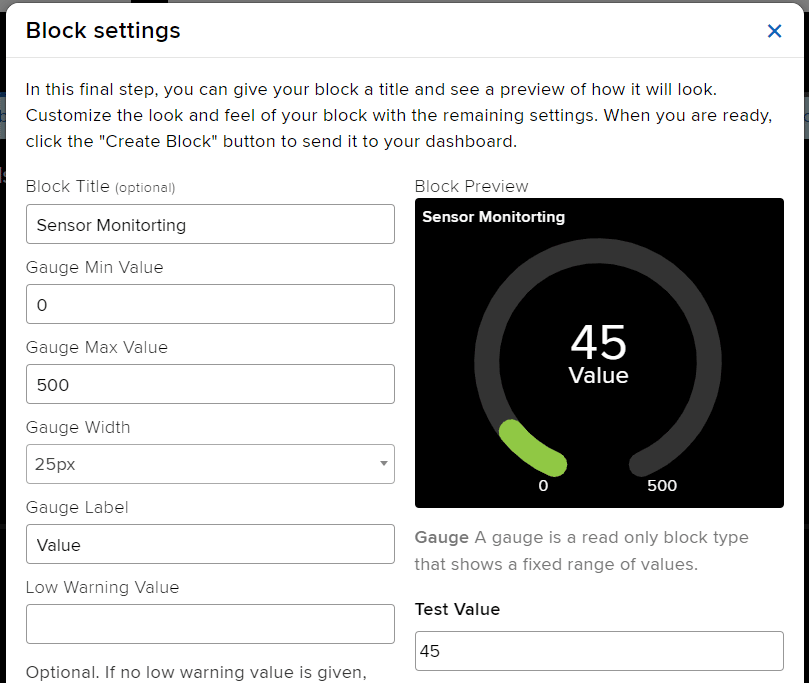
- Block is added.
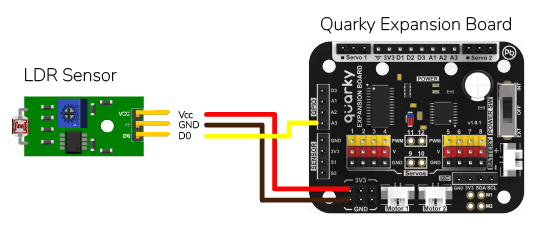
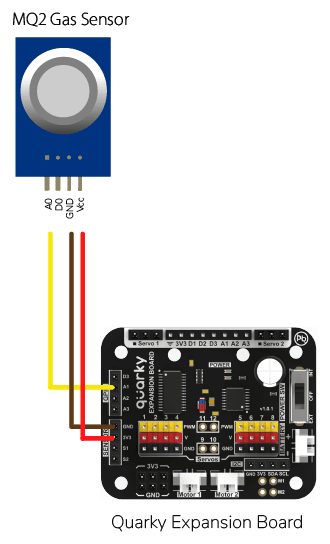
Circuit of Gas Sensor
The relay has the following connections:
- GND Pin connected to GND of the Quarky Expansion Board.
- VCC Pin connected to VCC of the Quarky Expansion Board.
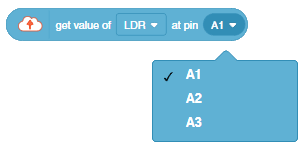
- AO (Signal Pin) connected to Analog Pin A1 of the Quarky Expansion Board.
All About MQ2 Gas Sensor
Gas sensors are designed to measure the concentration of gases in the environment. MQ2 gas sensor is suitable for detecting H2, LPG, CH4, CO, Alcohol, Smoke or Propane. Due to its high sensitivity and fast response time, measurements can be taken as soon as possible.
Note: The sensor value only reflects the approximated trend of gas concentration in a permissible error range, it DOES NOT represent the exact gas concentration. The detection of certain components in the air usually requires a more precise and costly instrument, which cannot be done with a single gas sensor.
MQ-2 Gas Sensor Sensitivity Characteristics:
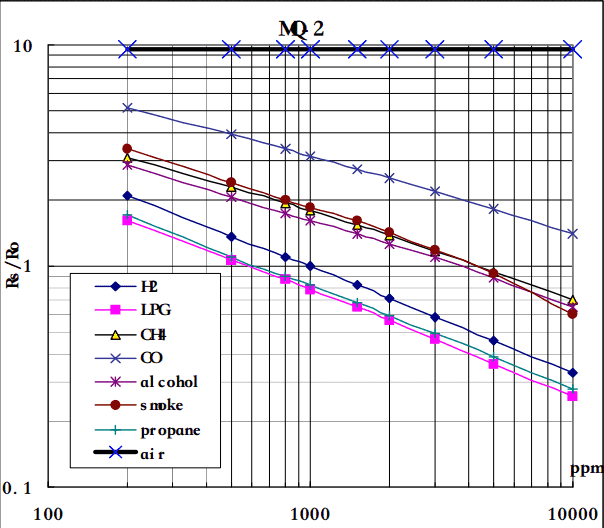
The graph tells us the concentration of a gas in part per million (ppm) according to the resistance ratio of the sensor (RS/R0).
- RS is the resistance of the sensor that changes depending on the concentration of gas.
- R0 is the resistance of the sensor at a known concentration without the presence of other gases, or in the fresh air.
For air, RS/R0 = 9.8 for the MQ2 gas sensor.
Note: According to the graph, we can see that the minimum concentration we can test is 100ppm and the maximum is 10000 ppm, in another word, we can get a concentration of gas between 0.01% and 1%.
Calculation of R0 for the Sensor
RS = [(Vin x RL) / Vout] - RL
- Vin is 5V in our case.
- RL is 10 kOhm
- Vout is the analog voltage reading from the sensor
We can simplify the above formula by omitting RL:
RS = (Vin - Vout) / Vout
From the graph, we can see that the resistance ratio in fresh air is constant:
RS / R0 = 9.8
To calculate R0 we will need to find the value of the RS in the fresh air using the above formula. This will be done by taking the analog average readings from the sensor and converting it to voltage. Then we will use the RS formula to find R0.
R0 = RS / 9.8
Calculating PPM for a particular gas
Let’s analyze the graph:
- The scale of the graph is log-log. This means that on a linear scale, the behavior of the gas concentration with respect to the resistance ratio is exponential.
- The data for gas concentration only ranges from 200 ppm to 10000 ppm.
- Even though the relation between resistance ratio and gas concentration may seem linear, in reality, it is not.
First of all, we will treat the lines as if they were linear. This way we can use one formula that linearly relates the ratio and the concentration. By doing so, we can find the concentration of a gas at any ratio value even outside of the graph’s boundaries. The formula we will be using is the equation for a line, but for a log-log scale. The formula for a line is:
y = mx + b
Where:
y: X value
x: X value
m: Slope of the line
b: Y intercept
For a log-log scale, the formula looks like this:
log(y) = m*log(x) + b
Note: The log is base 10.
Continue writing text from here.
Okay, let’s find the slope. To do so, we need to choose 2 points from the graph.
In our case, we chose the points (200,1.6) and (10000,0.27) from the LPG line. The formula to calculate m is the following:
m = [log(y) - log(y0)] / [log(x) - log(x0)]
If we apply the logarithmic quotient rule we get the following:
m = log(y/y0) / log(x/x0)
Now we substitute the values for x, x0, y, and y0:
m = log(0.27/1.6) / log(10000/200)
m = -0.473
Now that we have m, we can calculate the y-intercept. To do so, we need to choose one point from the graph (once again from the LPG line). In our case, we chose (5000,0.46)
log(y) = m*log(x) + b
b = log(y) - m*log(x)
b = log(0.46) - (-0.473)*log(5000)
b = 1.413
Now that we have m and b, we can find the gas concentration for any ratio with the following formula:
log(x) = [log(y) - b] / m
However, in order to get the real value of the gas concentration according to the log-log plot we need to find the inverse log of x:
x = 10 ^ {[log(y) - b] / m}
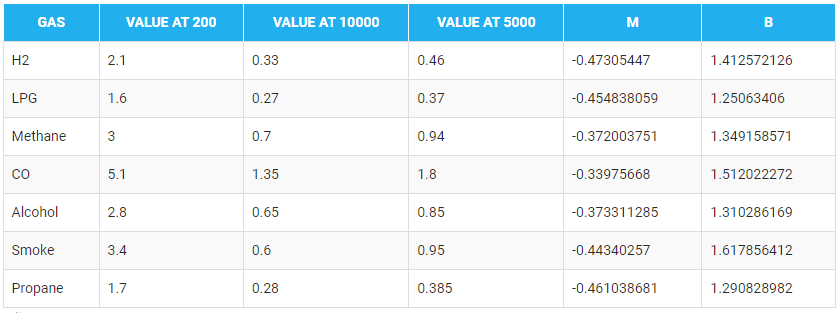
In the table given below, you can find the value of m and b for different gases.
Script
There are two steps to calculating PPM for the gas:
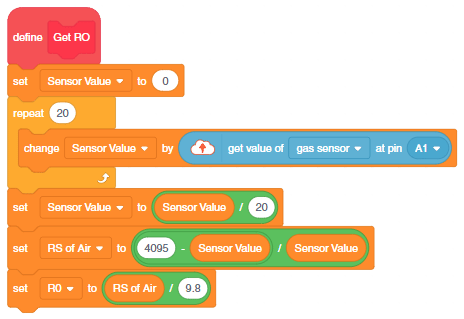
- First, we will calculate the value of R0. To calculate R0 we need to find out the value of Rs in the fresh air, this will be done by taking analog average readings from the sensor and converting it into the corresponding voltage value, then we will use the above formula to calculate R0, wait until we get the stable value of R0. Make this script in the PictoBlox to get the value of R0.
- After that, we will use the above-calculated value of R0 to find out the concentration of gases in ppm and send it to the cloud.
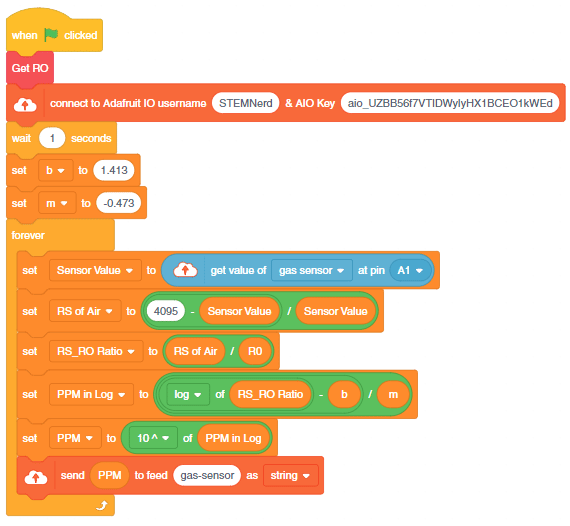
Note: If you want to detect other gases, change the value of b and m in the program according to the sensor from the table.
Output
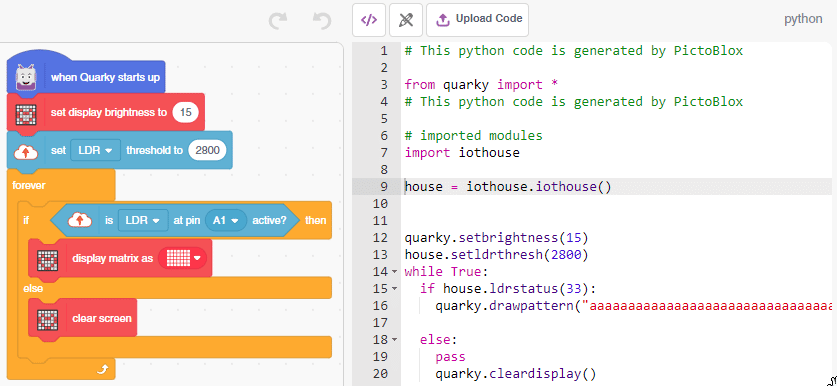
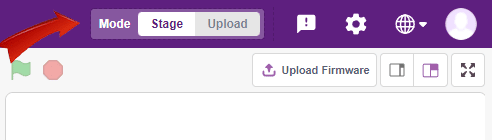
Upload Mode
You can also make the project work independently of PictoBlox using the Upload Mode. For that switch to upload mode and replace the when green flag clicked block with when Quarky starts up the block.
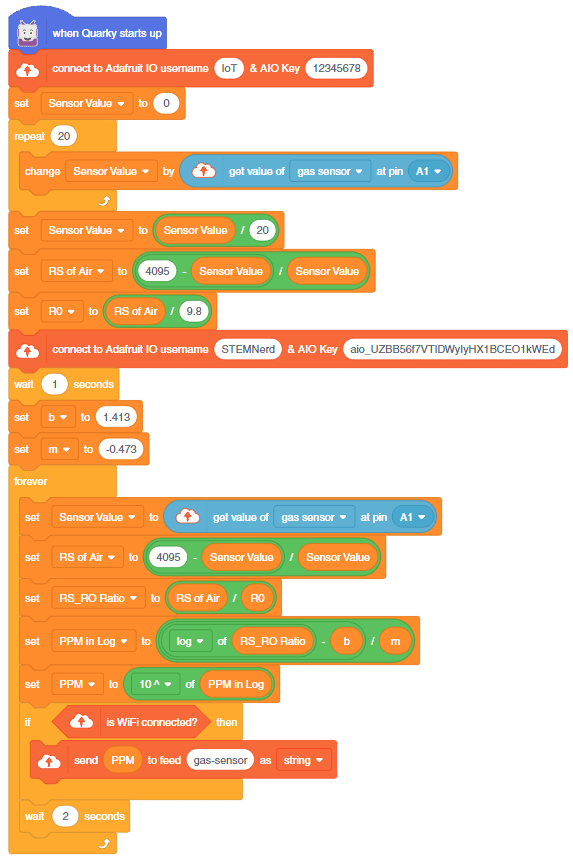
You can download the code from here: IoT- based Air Pollution Monitoring System – Upload Mode