Introduction
The Oscilloscope module allows you to visualize the input and output signals of your hardware device on your smartphone. Like an oscilloscope has different channels to plot data from different sources, similarly, in this module also, you can plot data from two different sources connected to your hardware. You can send data for both channels or any one channel at a time, adjust the scaling of the time and magnitude axis and also store the coming data in the form of CSV files. You can visual signals of frequency up to 50 Hz properly. On higher frequencies, there is a distortion in plotting.
Channel Selection and Time Axis Adjustments
The module is configured at the following settings by default:
- Both the channels in the module are on. The red-colored channel is channel 1 and the green-colored channel is channel 2.
- The Voltage axis is set in volts/div with each division of 6V.
- The Time axis is set in ms/div with each division of 100 ms (millisecond).
In order to adjust the voltage scale or time scale or active channel settings follow the below steps:
- At the bottom of the oscilloscope screen, you can see an arrow pointing upwards. Drag that arrow up and you can see a user interface that has slide switch and slider interfaces.
- Using a slide switch icon you can turn on or off the channel depending upon how many channel data you want to plot. For example, if you want to send data on channel 1 only then you can switch off channel 2.
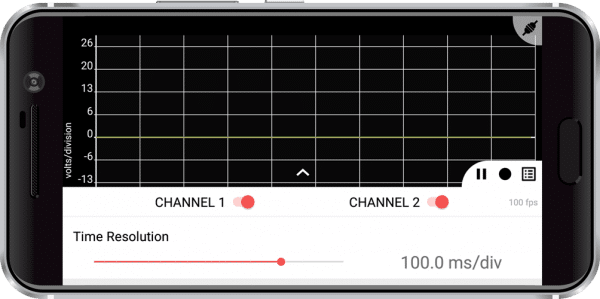
- Use the time scale slider to adjust time per division. You can adjust it to different values as per your needs.
- There is also a panel of three buttons at the top right corner of the settings menu as shown below:
- The first button is the Start/Stop button to control plotting on the module.
- The second button is for recording Data. You can log the data received by this module by recording it using this button. The recorded data is stored in the form of a CSV file.
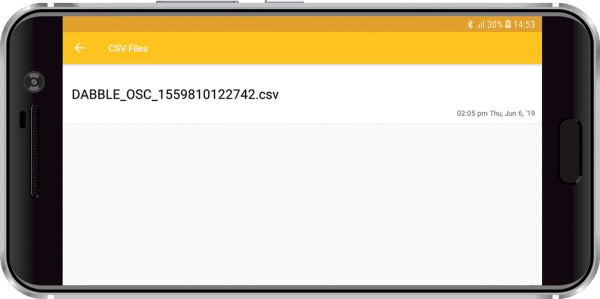
- The third button is used to open the list of CSV files recorded by this module. By clicking on this button you navigate to the following screen where the list of all recorded files is present.
- The magnitude scale is a bit tricky to understand so read this section carefully.
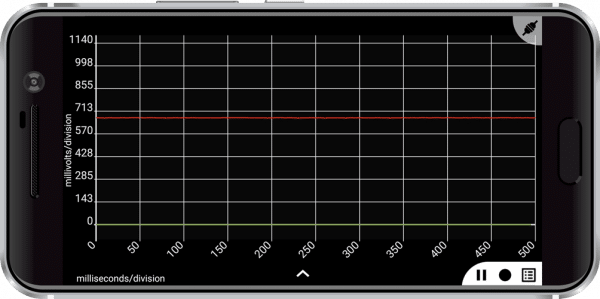
- You can set the voltage scale in millivolts/div or volts/div. When you open the module you can see the scale in volts/div.
- In order to change this scaling, you can pinch on the screen to zoom in or zoom out. To get the scale in millivolts/div you have to zoom in to the screen several times so be patient while doing that.

As stated earlier this module works differently as compared to other modules therefore in order to use this module correctly follow the steps below for both PictoBlox as well as Arduino:
- Disconnect Bluetooth if it is already connected.
- Upload code shared below (For both Arduino and Pictoblox)
- Open Oscilloscope Module
- Now connect Bluetooth
- Adjust the scale as per the Data Range you are plotting.
Arduino IDE Functions
Download the zip file of Oscilloscope Library for evive, Mega, Uno, and Nano from here: Oscilloscope_Dabble
Functions
- Oscilloscope.begin(SerialChannel) – This function is used for initializing the data transfer process between your hardware and Smartphone. The argument SerialChannel is the name of the Serial channel on which your Bluetooth is connected to the hardware board.
- Oscilloscope.sendDataChannel1(data) – This function is for sending Data on channel 1 of the module.
- Oscilloscope.sendDataChannel2(data) – This function is for sending Data on channel 2 of the module.
PictoBlox (Scratch) Blocks
There are mainly two types of blocks for this module one it to change baud rate and one is for selecting the channel and sending data.
evive
With “set bluetooth baudrate to () for Oscilloscope” connect the Bluetooth on the Bluetooth slot of evive and select the baud rate as per baud for your Bluetooth from the drop-down.
Mega
In the stacked block “connected bluetooth on serial () at baudrate ()” select the serial channel on which you connect the Bluetooth module and also select the baud as per your Bluetooth module.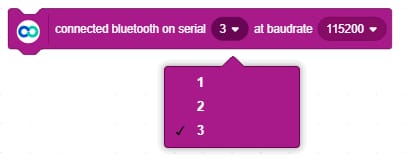
Uno and Nano
Connect Bluetooth on Serial 0 and select the baud rate for your Bluetooth module.
The stacked block “send data () on channel ()” is for sending data on the oscilloscope channel. It has one text box where you have to write the data to be plotted followed by a drop-down where you have to select the channel on which you want to plot the data.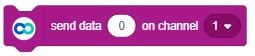
Examples
Arduino IDE Example for Oscilloscope Module
In the below codes, we will visualize the voltage level across an analog pin of your board. For this, we will follow the following steps:
- Read data of analog pin. You can connect any sensor or a simple potentiometer anything like that in which you can get a variable output voltage between 0 and 5V.
- Convert it into millivolts.
- Send it to the Smartphone so that its graph can be plotted.
In both the code given below, a function block converts analog reading read by hardware into millivolts.
evive and Mega
#include <OscilloscopeModule.h>
void setup() {
  /*
    NOTE:
    Oscilloscope module does not follow standard procedure of data transfer like other modules.
    Before connecting with bluetooth open Oscilloscope module first.
  */
  //Enter the baudrate of your bluetooth in below function
  Serial3.begin(9600);         //For increasing data transfer speed over bluetooth connect it on HardwareSerial 0 for Uno or Nano and on either of HardwareSerial 1,2,3 for Arduino Mega.
  Oscilloscope.begin(Serial3);   //this function wait for connection with Dabble App
}

void loop() {
  float data = convertToMilliVolt(analogRead(A9),10);   // the resolution of ADC channel is 10 bits. Pin A9 on evive is connected with Potentiometer 1
  Oscilloscope.sendDataChannel1(data);  //you can connect a potentiometer or any analog sensor to visualize its Data  on Oscilloscope Module
}

float convertToMilliVolt(float value, int adc_resolution)
{
  float a = value;
  a = value/(pow(2,adc_resolution));
  a = a*5000;                       // Multiplied by 5000 because 5000 millivolts(5V) is maximum that can be given to analog pins.
  return a;
}
Uno and Nano
#include <OscilloscopeModule.h>
void setup() {
  /*
    NOTE:
    Oscilloscope module does not follow standard procedure of data transfer like other modules.
    Follow the procedure below for connection:
    1.Disconnect Bluetooth if it is already connected.
    2.Upload code shared below (For both Arduino and Pictoblox)
    3.Open Oscilloscope Module
    4.Now connect Bluetooth
    5.Adjust scale as per your Data Range you are plotting.
  */
  //Enter the baudrate of your bluetooth in below function
  Serial.begin(115200);         //For increasing data transfer speed over bluetooth connect it on HardwareSerial 0 for Uno or Nano and on either of HardwareSerial 1,2,3 for Arduino Mega.
  Oscilloscope.begin(Serial);   //this function wait for connection with Dabble App
}

void loop() {
  float data = convertToMilliVolt(analogRead(A0),10);   // the resolution of ADC channel is 10 bits.
  Oscilloscope.sendDataChannel1(data);  //you can connect a potentiometer or any analog sensor to visualize its Data  on Oscilloscope Module
}

float convertToMilliVolt(float value, int adc_resolution)
{
  float a = value;
  a = value/(pow(2,adc_resolution));
  a = a*5000;                       // Multiplied by 5000 because 5000 millivolts(5V) is maximum that can be given to analog pins.
  return a;
}
PictoBlox Example for Oscilloscope Module
In the below scripts, we will visualize the voltage level across an analog pin of your board. For this, we will follow the following steps:
- Read data of analog pin. You can connect any sensor or a simple potentiometer anything like that in which you can get a variable output voltage between 0 and 5V.
- Convert it into millivolts.
- Send it to the Smartphone so that its graph can be plotted.
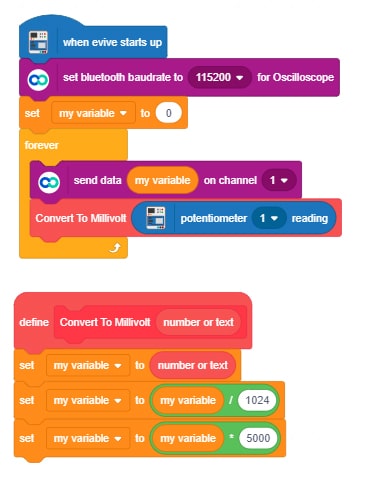
In both the scripts given below, a function block is defined that converts analog reading read by hardware into millivolts.
evive
Uno
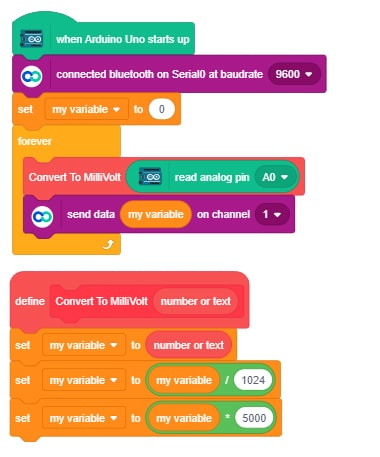
The code for Nano and Mega blocks also remains the same you just have to change the head block and baud rate block as per your board.