Numbers(C/R) is the extension of the ML Environment that deals with the regression of numeric data.
What is Regression?
Regression is defined as a statistical method that helps us to analyze and understand the relationship between two or more variables of interest. The process that is adapted to perform regression analysis helps to understand which factors are important, which factors can be ignored, and how they are influencing each other.
In regression, we normally have one dependent variable and one or more independent variables. Here we try to “regress” the value of the dependent variable “Y” with the help of the independent variables. In other words, we are trying to understand, how the value of ‘Y’ changes w.r.t change in ‘X’.
For the regression analysis is be a successful method, we understand the following terms:
- Dependent Variable: This is the variable that we are trying to understand or forecast.
- Independent Variable: These are factors that influence the analysis or target variable and provide us with information regarding the relationship of the variables with the target variable.
Real Estate Price Prediction
In this tutorial, we’ll be looking at Numeric Regression with the help of the “Real Estate Price Prediction” dataset.
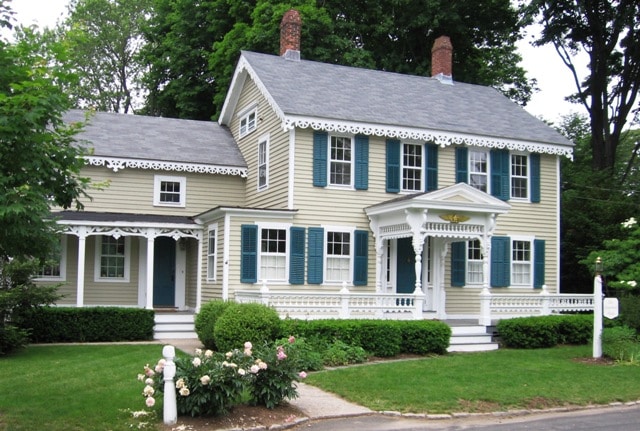
This dataset contains the price per unit area of multiple real estate sites and features that dictate the price per unit area. We’ll be constructing a model that can predict the price of real estate using previously unseen features.
Download the dataset here:
- Training Data: Real Estate Training Data
- Testing Data: Real Estate Testing Data
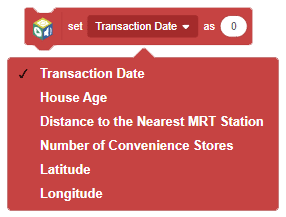
There are six input variables:
- Transaction Date
- House Age
- Distance to the Nearest MRT Station
- Number of Convenience Stores
- Latitude
- Longitude
The output is the house price of the unit area.
Setting up the Environment
First, we need to set the ML environment for Number classification.

Follow the steps below:
- Open PictoBlox and create a new file.
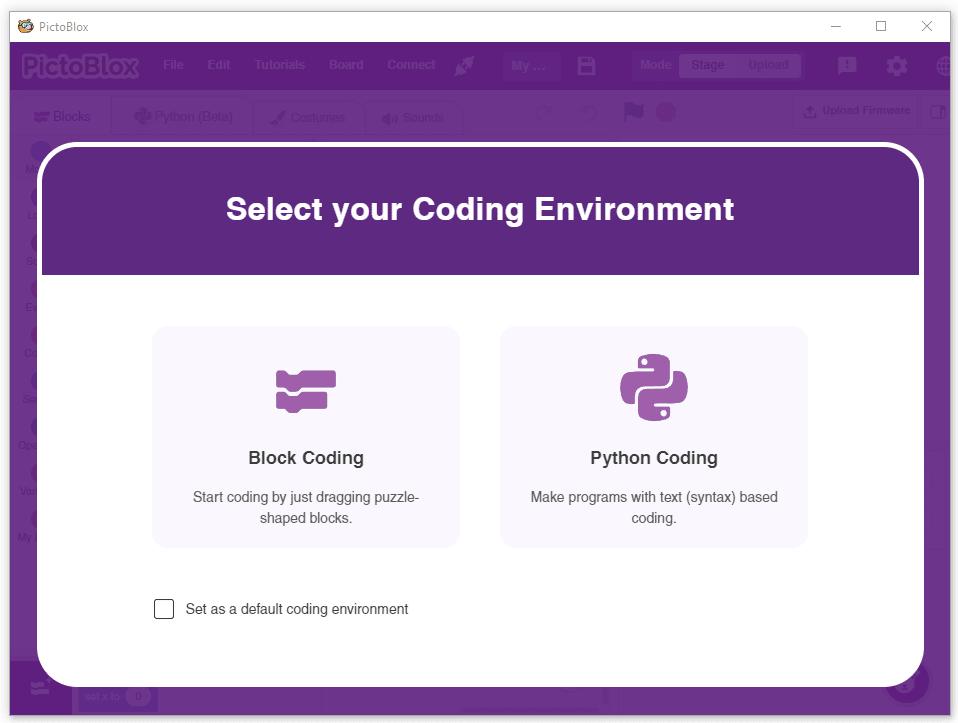
- Select the coding environment as Block Coding.
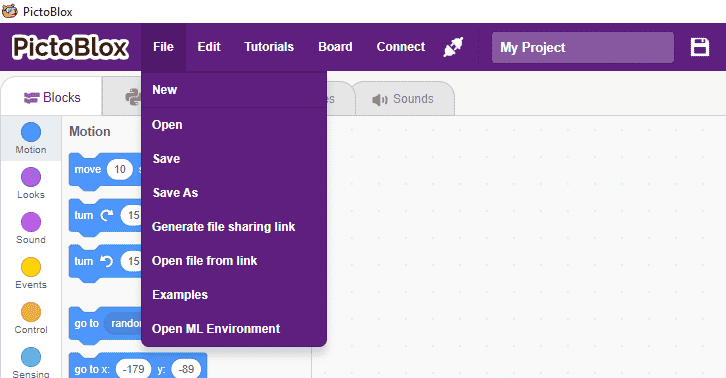
- To access the ML Environment, select the “Open ML Environment” option under the “Files” tab.
- You’ll be greeted with the following screen.
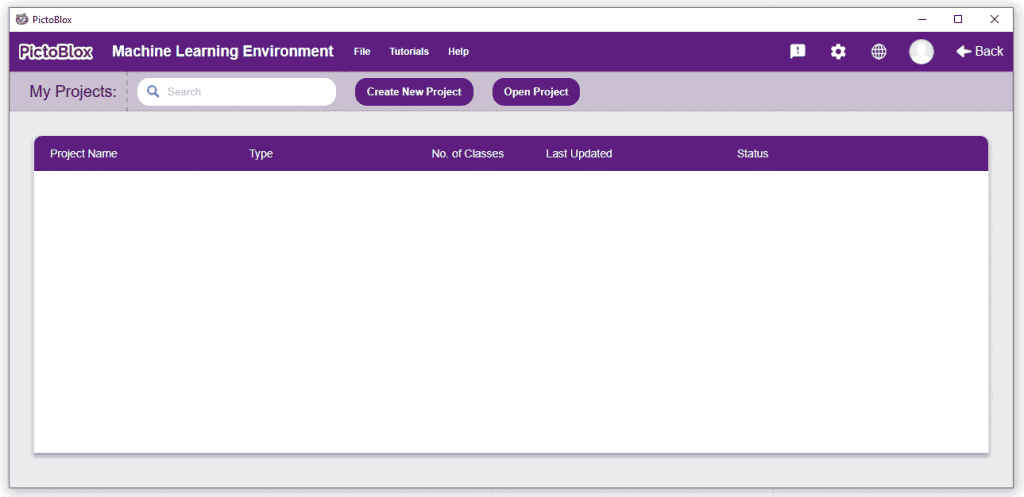 Click on “Create New Project“.
 - A window will open. Type in a project name of your choice and select the “Numbers(C/R)” extension. Click the “Create Project” button to open the Numbers(C/R) window.
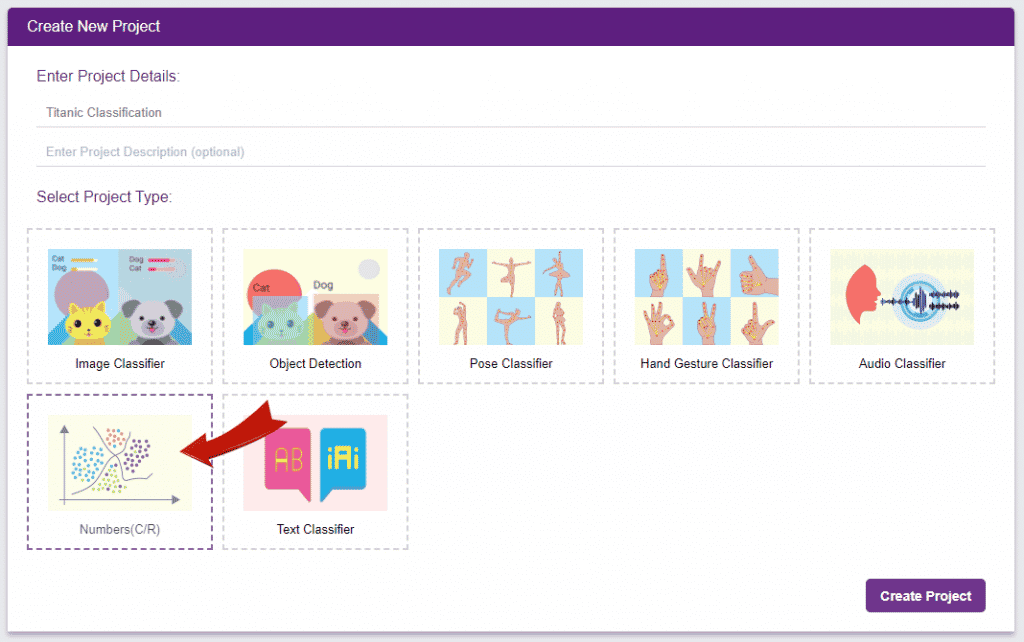
- You shall see the Numbers C/R workflow with an option to either “Upload Dataset” or “Create Dataset”.
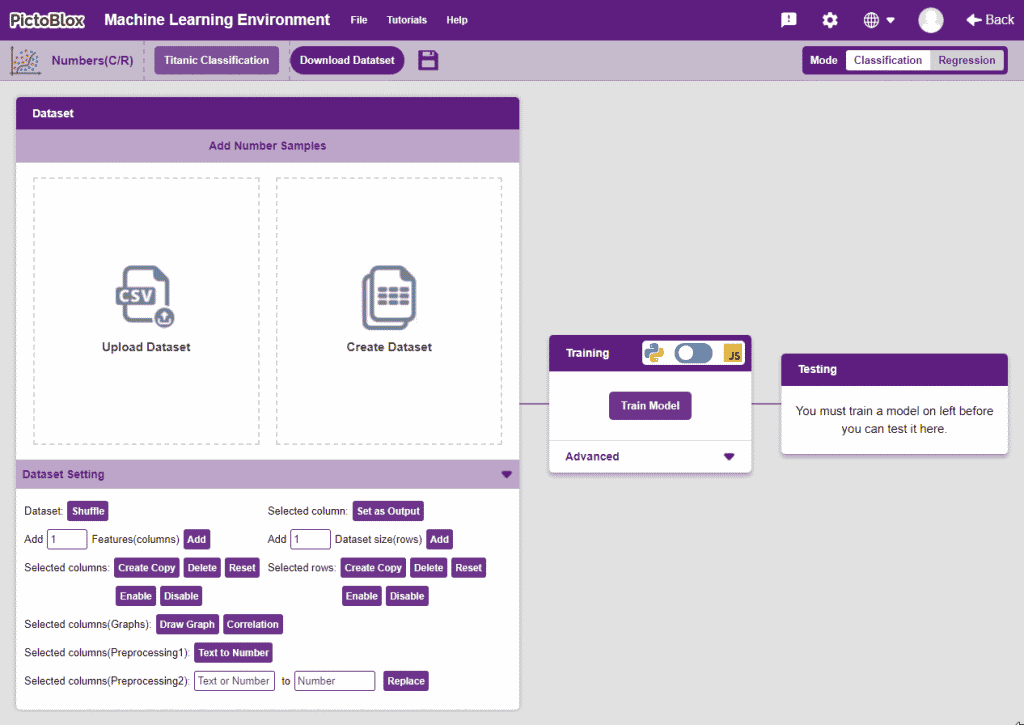
Uploading/Creating the Dataset
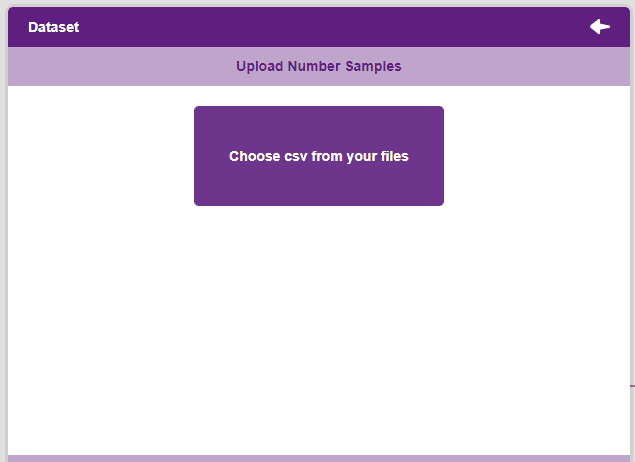
- Click on “Upload Dataset”, and then on “Choose CSV from your files”.
- Select the “titanic_train.csv” file of the Titanic dataset. This is how your data will look.
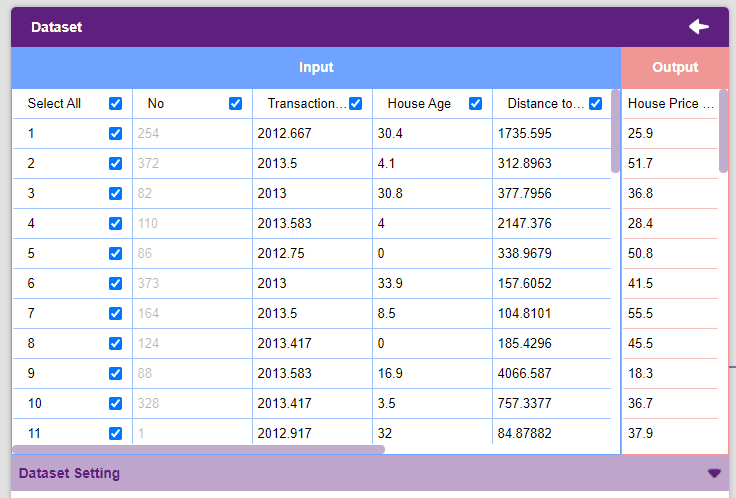
 Note: For our model to train, it is important that we only feed it numerical values. Hence, we must pre-process our data accordingly. Thankfully, the PictoBlox ML Environment comes with all the necessary tools to modify our data.
 - Let’s analyze the data pre-processing features for a minute. Observe the “Data Settings”.
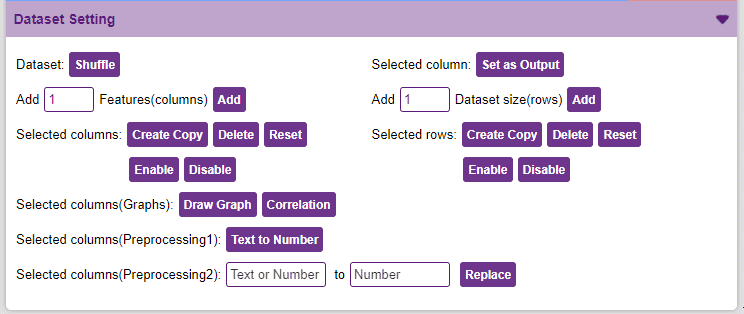
- We will be dropping the “No” columns.
- Our target column in this project is the “House Price of Unit Area” column. To set it as the output column, select it and click on the Set as Output button.
Our dataset is ready! Time to train the model.
Training the Model
Now that we have gathered the data, it’s time to teach our model how to classify new, unseen data into these classes. To do this, we have to train the model.
By training the model, we extract meaningful information from the data, and that in turn updates the weights. Once these weights are saved, we can use our model to make predictions on data previously unseen.
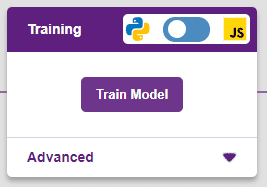
However, before training the model, there are a few hyperparameters that you should be aware of. Click on the “Advanced” tab to view them.
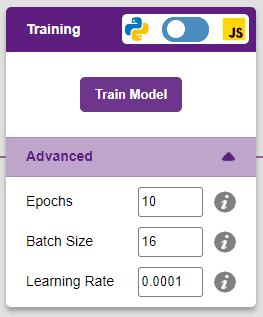
There are three hyperparameters you can play along with here:
- Epochs– The total number of times your data will be fed through the training model. Therefore, in 10 epochs, the dataset will be fed through the training model 10 times. Increasing the number of epochs can often lead to better performance.
- Batch Size– The size of the set of samples that will be used in one step. For example, if you have 160 data samples in your dataset, and you have a batch size of 16, each epoch will be completed in 160/16=10 steps. You’ll rarely need to alter this hyperparameter.
- Learning Rate– It dictates the speed at which your model updates the weights after iterating through a step. Even small changes in this parameter can have a huge impact on the model performance. The usual range lies between 0.001 and 0.0001.
You can train the model in both JavaScript and Python. To choose between the two, click on the switch on top of the Training box.
We’ll be training this model in Python. Click on the “Train Model” button to commence training. It’s a good idea to use a high number of epochs for this model. We’ll be training this model for 100 epochs.
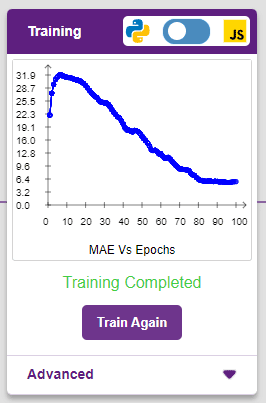
The model shows great results! Remember, in regression problems, we use a metric called Mean Absolute Error(MAE). The lower the MAE, the better the model. The x-axis of the graph shows the epochs, and the y-axis represents the corresponding MAE.
Testing the Model
Now that the model is trained, let us see if it delivers the expected results. For that, we simply need to input values and click on the “Predict” button.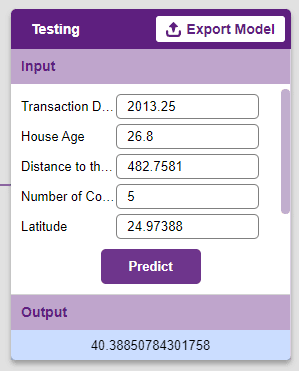
Great! Time to export this model to PictoBlox and create a script.
Exporting the Model to the Block Coding
Click on the “Export Model” button on the top right of the Testing box, and PictoBlox will load your model into the Block Coding Environment.
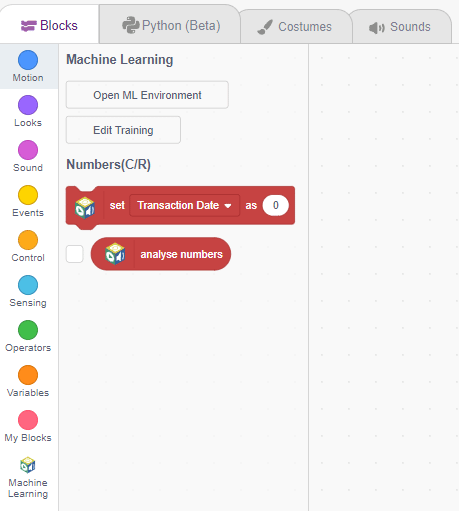
Observe the blocks appear:
- Using the set () as () block, you can assign different values to different variables.
- Using the Analyse Numbers block, you can get the model’s prediction for the given input. You can check the box if you want the prediction to appear on the stage at all times.

The script in Block Coding
Now we’ll use our model in an actual project. We’ll be making use of the block coding environment to do so.
We’ll make a simple script where we enter the values and Toby tells us the cost of the real estate.
Let’s begin!
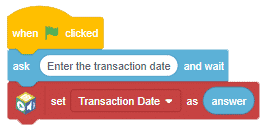
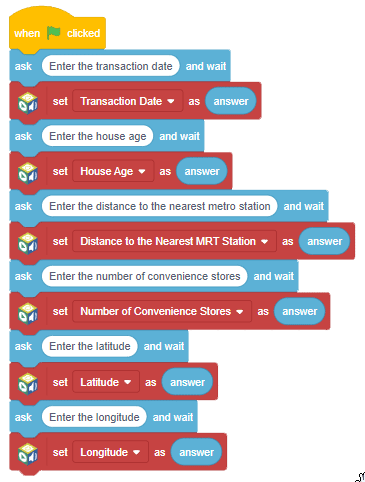
- We’ll start by adding a when flag clicked block from the Events palette.
- Since we want Tobi to ask us for values, we’ll be adding an ask () and wait block from the Sensing palette.
- Follow it up with a set () as () blocks from the Machine Learning palette.
- Add an answer block from the Sensing palette inside of the set () as () block to use the user’s input for making predictions.
- As we are working with 6 variables, duplicate the ask () and wait block and set () as () block for a total of 6 times.
Note: Right-click on a block to duplicate all the blocks below it.
- Use the dropdown to change the class of the set() as () block. Add corresponding statements to the ask () and wait block.
- Finally, add a say block from the Looks palette, and add an Analyse Numbers block from the Machine Learning palette inside of it.
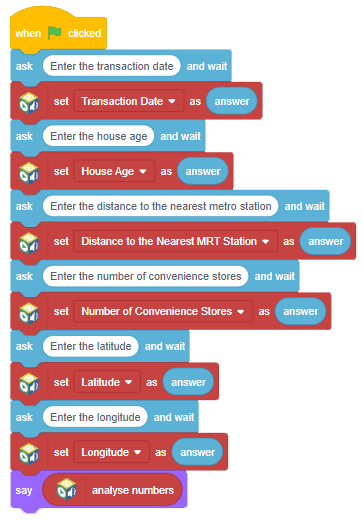
To run our script, click the green flag.
There you go! A real estate price detection script.