Introduction
Numbers(C/R) is the extension of the ML Environment that deals with the classification and regression of numeric data. In this tutorial, we’ll be looking at Numeric Classification with the help of the “Titanic Dataset”.
Titanic Challenge
The sinking of the Titanic is one of the most infamous shipwrecks in history.

On April 15, 1912, during her maiden voyage, the widely considered “unsinkable” RMS Titanic sank after colliding with an iceberg. Unfortunately, there weren’t enough lifeboats for everyone onboard, resulting in the death of 1502 out of 2224 passengers and crew.
While there was some element of luck involved in surviving, it seems some groups of people were more likely to survive than others.
In this tutorial, we will build a predictive model that answers the question: “what sorts of people were more likely to survive?” using passenger data (ie name, age, gender, socio-economic class, etc).
Titanic Dataset
The Titanic dataset contains information about the passengers on the ship and whether they survived the sinking of the ship or not. The target column is titled “Survived” and it consists of binary values.
- Value “1” denotes that the passenger survived.
- Value “0” denotes that the passenger did not survive.
Download the dataset here:
- Training Data: titanic_train
- Testing Data: titanic_test
Let’s start!
Setting up the Environment
First, we need to set the ML environment for Number classification.

Follow the steps below:
- Open PictoBlox and create a new file.
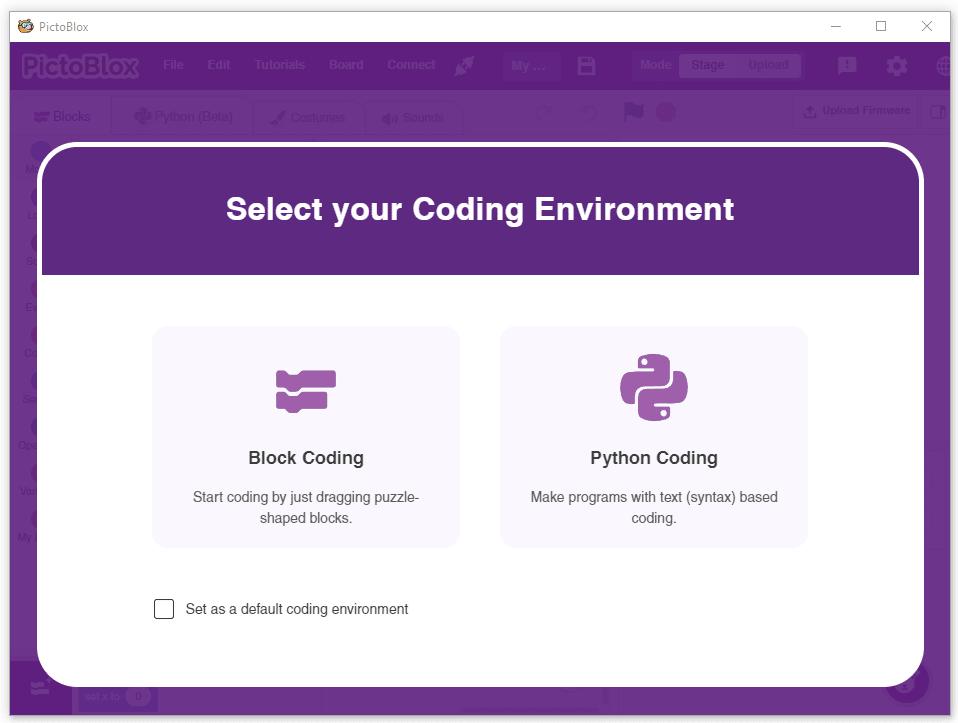
- Select the coding environment as Block Coding.
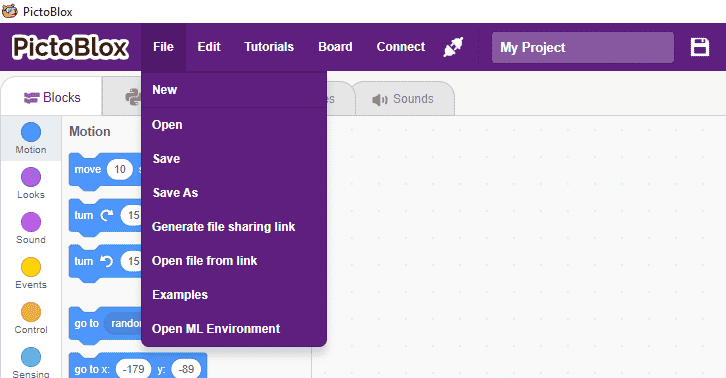
- To access the ML Environment, select the “Open ML Environment” option under the “Files” tab.
- You’ll be greeted with the following screen.
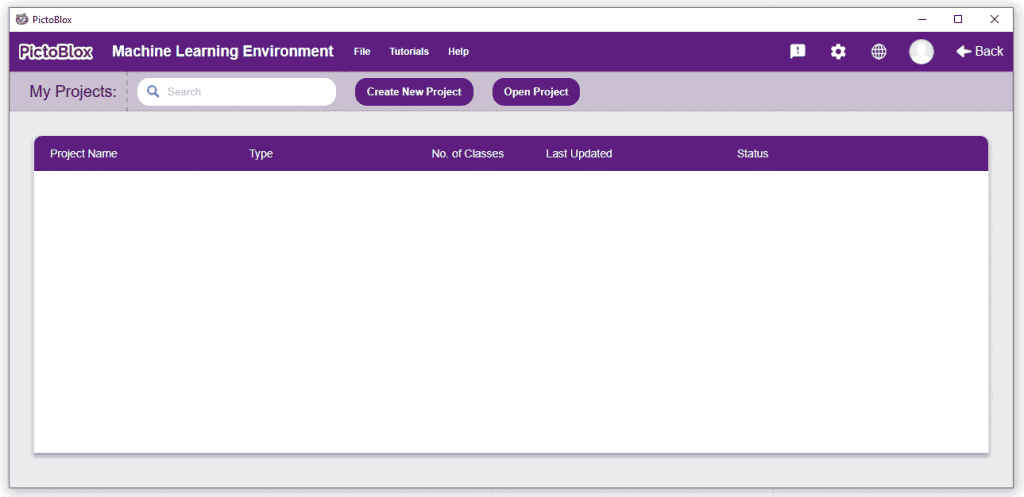 Click on “Create New Project“.
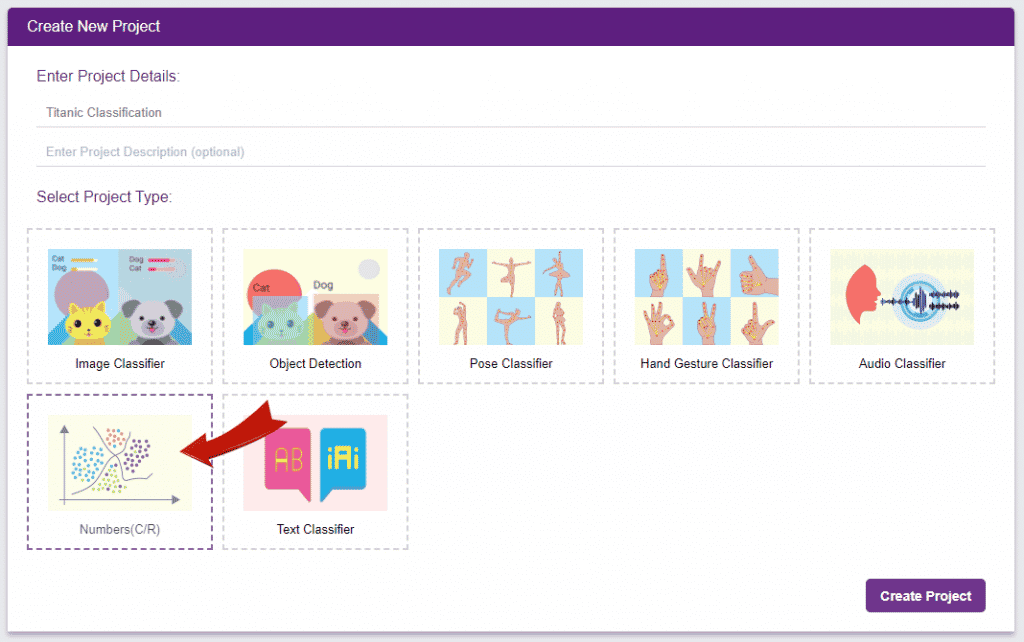
 - A window will open. Type in a project name of your choice and select the “Numbers(C/R)” extension. Click the “Create Project” button to open the Numbers(C/R) window.
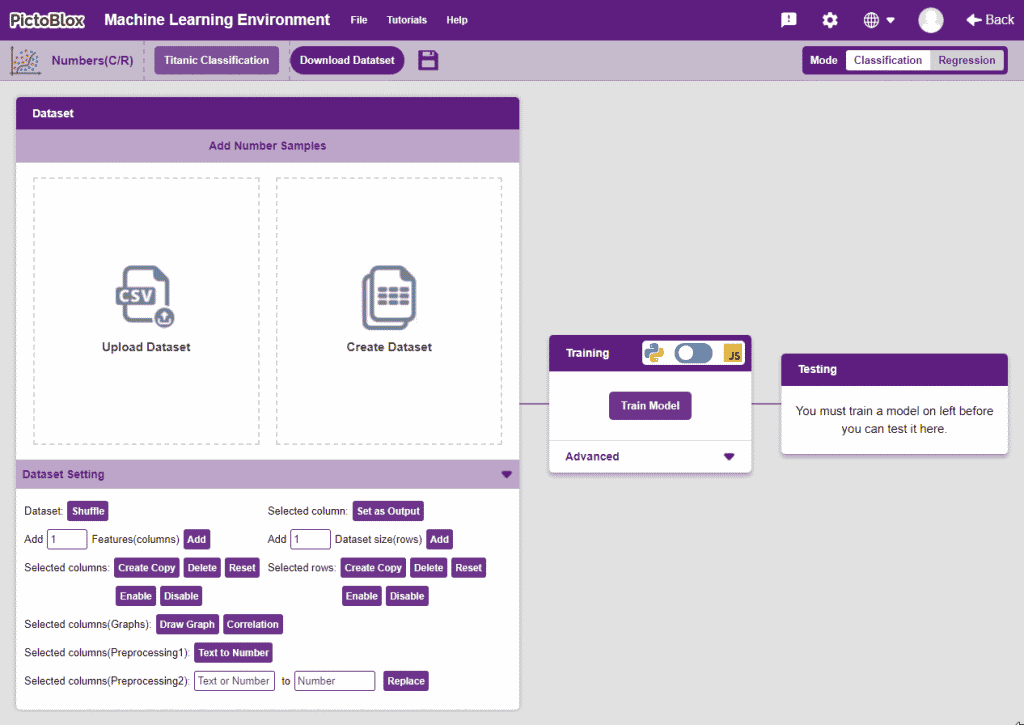
- You shall see the Numbers C/R workflow with an option to either “Upload Dataset” or “Create Dataset”.
Uploading/Creating the Dataset
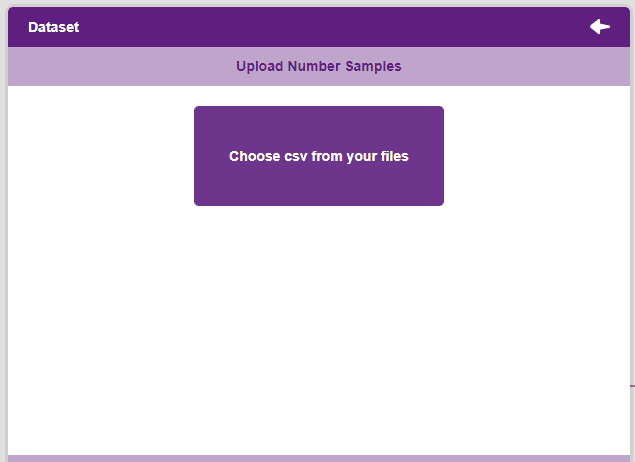
- Click on “Upload Dataset”, and then on “Choose CSV from your files”.
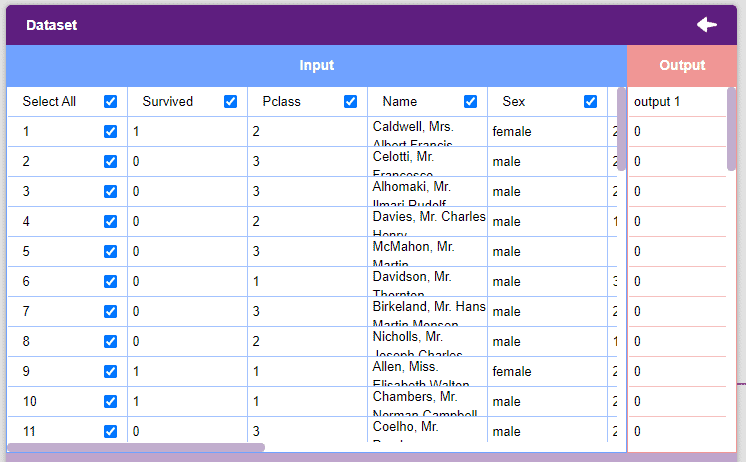
- Select the “titanic_train.csv” file of the Titanic dataset. This is how your data will look.
 Note: For our model to train, it is important that we only feed it numerical values. Hence, we must pre-process our data accordingly. Thankfully, the PictoBlox ML Environment comes with all the necessary tools to modify our data.
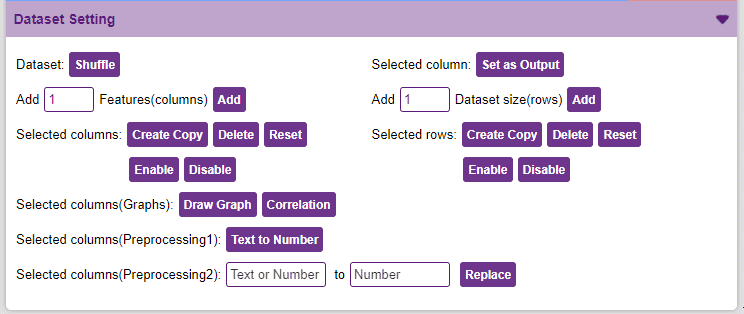
 - Let’s analyze the data pre-processing features for a minute. Observe the “Data Settings”.
- We will be dropping the “Name”, “Ticket”, and “Cabin” columns.
- Now we will convert the columns “Sex”, and “Embarked” into numeric values using the Text to Number button.
 Note: The “Text to Number” button assigns a number to all the unique values. If a column has three unique values, they will be assigned corresponding numbers starting with 0. Hence, the values in the case of three unique values would be 0, 1, and 2.
 - Our target column in this project is the “Survived” column. To set it as the output column, select it and click on the Set as Output button.
Our dataset is ready! Time to train the model.
Training the Model
Now that we have gathered the data, it’s time to teach our model how to classify new, unseen data into these classes. To do this, we have to train the model.
By training the model, we extract meaningful information from the data, and that in turn updates the weights. Once these weights are saved, we can use our model to make predictions on data previously unseen.
However, before training the model, there are a few hyperparameters that you should be aware of. Click on the “Advanced” tab to view them.
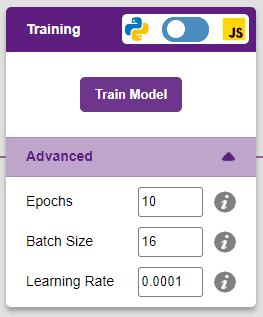
There are three hyperparameters you can play along with here:
- Epochs– The total number of times your data will be fed through the training model. Therefore, in 10 epochs, the dataset will be fed through the training model 10 times. Increasing the number of epochs can often lead to better performance.
- Batch Size– The size of the set of samples that will be used in one step. For example, if you have 160 data samples in your dataset, and you have a batch size of 16, each epoch will be completed in 160/16=10 steps. You’ll rarely need to alter this hyperparameter.
- Learning Rate– It dictates the speed at which your model updates the weights after iterating through a step. Even small changes in this parameter can have a huge impact on the model performance. The usual range lies between 0.001 and 0.0001.
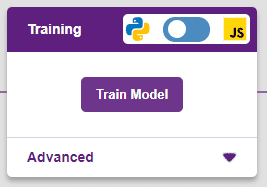
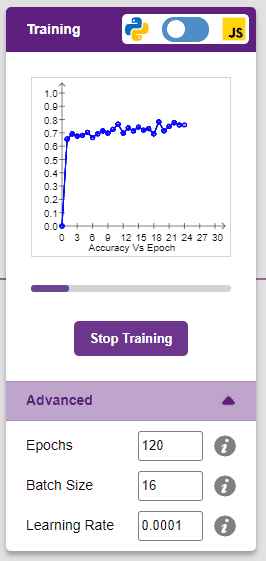
You can train the model in both JavaScript and Python. To choose between the two, click on the switch on top of the Training box.
We’ll be training this model in Python. Click on the “Train Model” button to commence training. It’s a good idea to use a high number of epochs for this model. We’ll be training this model for 120 epochs.
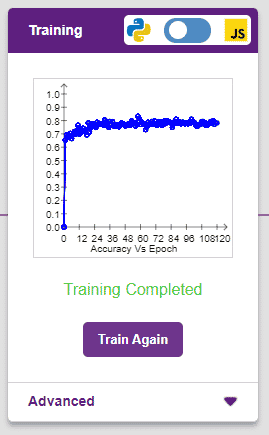
The model shows great results! Remember, the higher the reading in the accuracy graph, the better the model. The x-axis of the graph shows the epochs, and the y-axis represents the corresponding accuracy. The range of the accuracy is 0 to 1.
Testing the Model
Now that the model is trained, let us see if it delivers the expected results. For that, we simply need to input values and click on the “Predict” button.
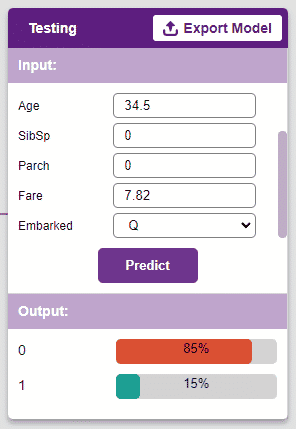
Great! Time to export this model to PictoBlox and create a script.
Exporting the Model to the Block Coding
Click on the “Export Model” button on the top right of the Testing box, and PictoBlox will load your model into the Block Coding Environment.
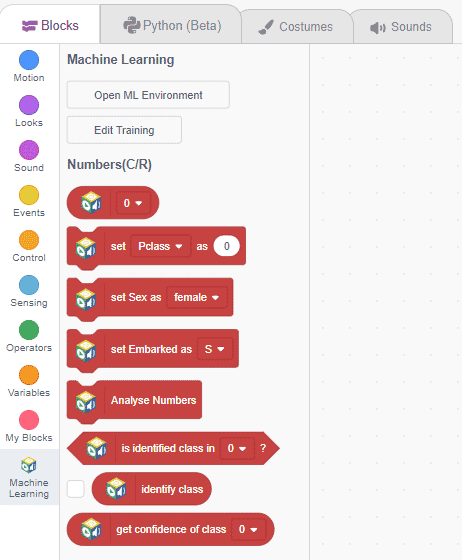
Observe the blocks appear:
- Using the set () as () block, you can assign different values to different classes.
- You’ll get special blocks for the classes you’ve converted from text to numbers.


- To analyze the numbers and make a prediction, you’ll use the Analyse Numbers block.

- You can use the is identified class in () block to check which class your input belongs to.

- get confidence of class () block returns the confidence level of the classification. It can be used as a threshold value.

The script in Block Coding
Now we’ll use our model in an actual project. We’ll be making use of the block coding environment to do so.
We’ll make a simple script where we enter the values and Toby tells us if the passenger survived the Titanic crash or not.
Let’s begin!
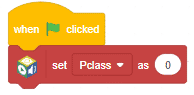
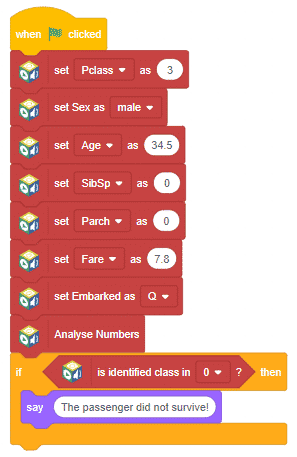
- We’ll start by adding a when flag clicked block from the Events palette.
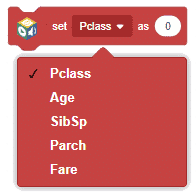
- Since we have to input values now, we’ll be adding a series of the set () as () blocks from the Machine Learning palette.
- Use the dropdown to change the class of the set () as () block.
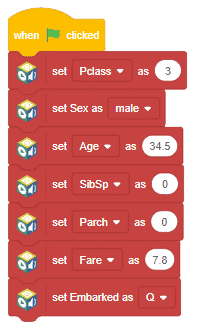 Note: It’s a good idea to attach classes in order of the dataset.
 - Attach the Analyse Numbers block from the Machine Learning palette after the classes to make a prediction using the model.
- Now to add conditions, attach an if () then block from the Control palette to our script.
- Add an is identified class in () block from the Machine Learning palette as your condition block.
- Inside of the if () then block, add a say block from the Looks palette, and type in a message of your choice.
- Now duplicate this if () then block, change the class, and type in a different message in the say block.
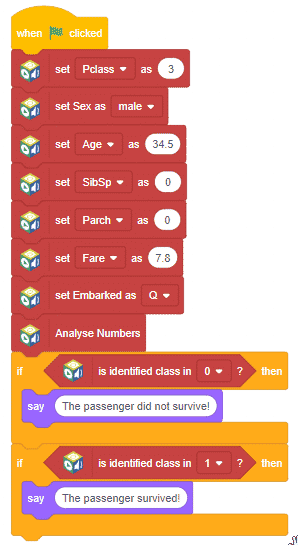 Note: You can duplicate a block by right-clicking on it and selecting the “Duplicate” option.
 - To test our script, enter corresponding inputs from the “titanic_train.csv” file and click the green flag.
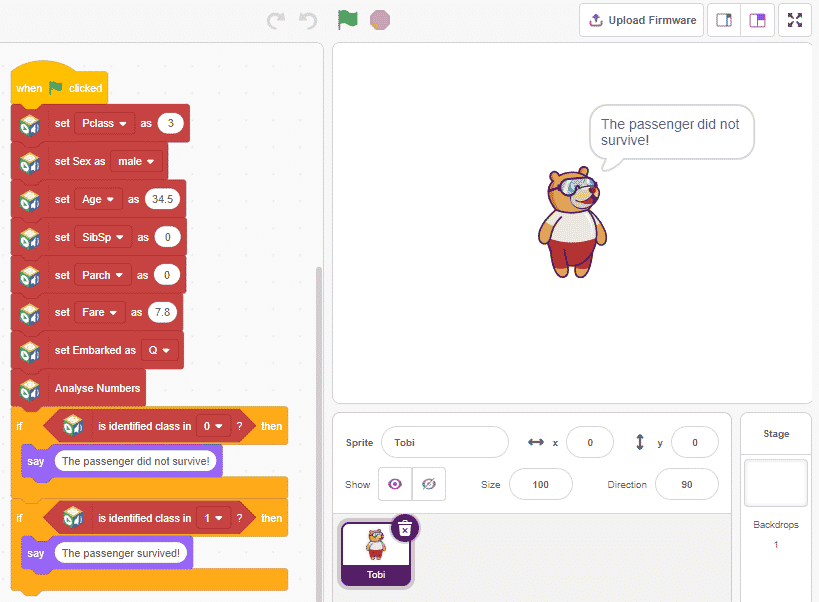
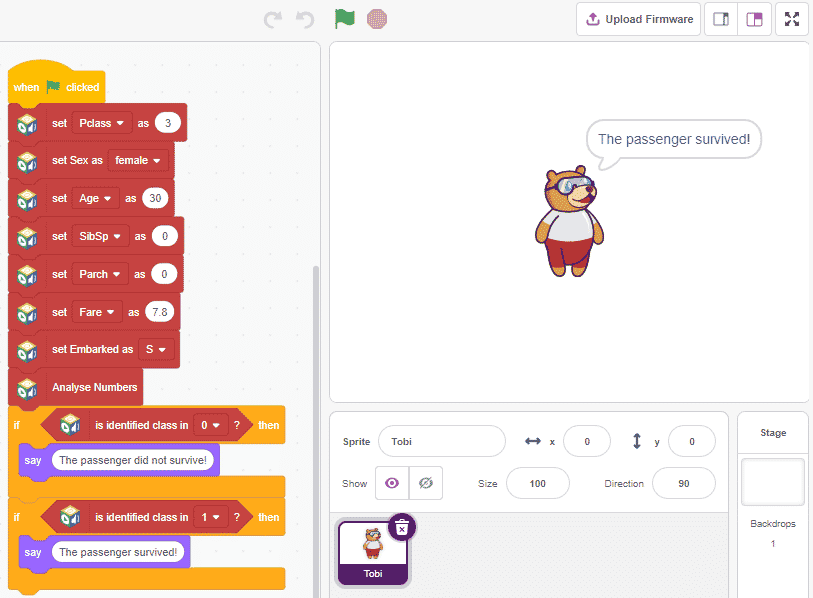
There you have it! A PictoBlox script for the Titanic Dataset.